
Address & Coin Distribution (+ a Rant)
Address & Coin Distribution (+ a Rant)
November 2021

Disclaimer
The on-chain data I use (BitInfoCharts, Coinglass, CoinMarketCap) to compile the tables and graphs contained in this analysis do not always align with the on-chain data found via others sources like Glassnode and CryptoQuant. I cannot fully explain the reason for the differences nor can I confirm which sources are most accurate. For this and other reasons, I have come to trust only the on-chain data I collect when trying to explain and/or predict Bitcoin’s future price action (PA). Whether you too find my analysis useful is for you to decide, but I can assure you that some of my observations and/or predictions will differ, often markedly, from other observations and/or predictions you will see on Crypto Twitter (CT) and elsewhere.
Monthly Price Action
November PA was no doubt a disappointment to many, and for no one more so than PlanB, I imagine. Not only did “Moonvember” fail to materialize, but BTC actually lost ground during the month, closing down 7.2%. Price opened at $61,344 (on Coinbase) and reached a new all-time high (ATH) daily close of $67,555 on November 8 before reversing course, ending the month at $56,988. In short, the final three weeks of the month bore witness to a steady decline in price. No, it did not “trade sideways” or “consolidate,” as some people have inexplicably claimed. It dropped.
Despite such high hopes going into the month, it appears that November has not been as kind to BTC investors as some seem to think, particularly in recent years.
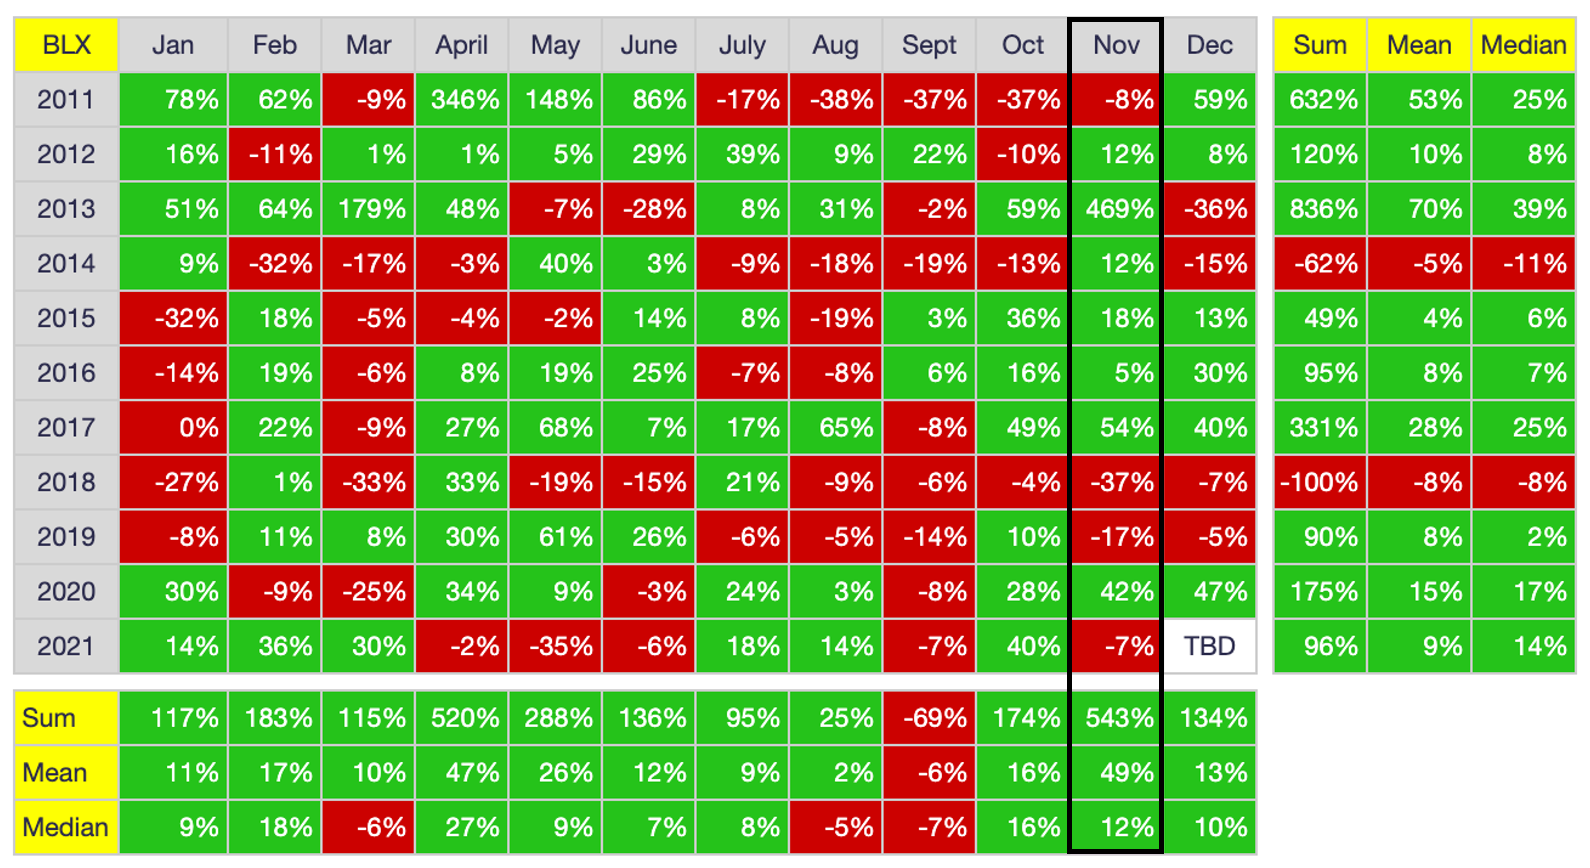
As shown above, November has been a down month three of the past four years (2018, 2019, 2021), with 2020 being the exception. In fact, if you exclude the surreal 469% increase of November 2013, November rates of return have been rather pedestrian historically speaking. February and April, for example, have been more consistently positive than November, and October (along with February and April) have higher median rates of return. Regardless, I share the chart above only to illustrate the mismatch between expectations and reality; trying to infer future PA based on calendar-month rates of return is misguided for many reasons, as I explain here. But even trying to infer future PA based on distance from the most recent halving is misguided, as I have learned myself these past few months. More on this below.
Monthly On-Chain Data Analysis
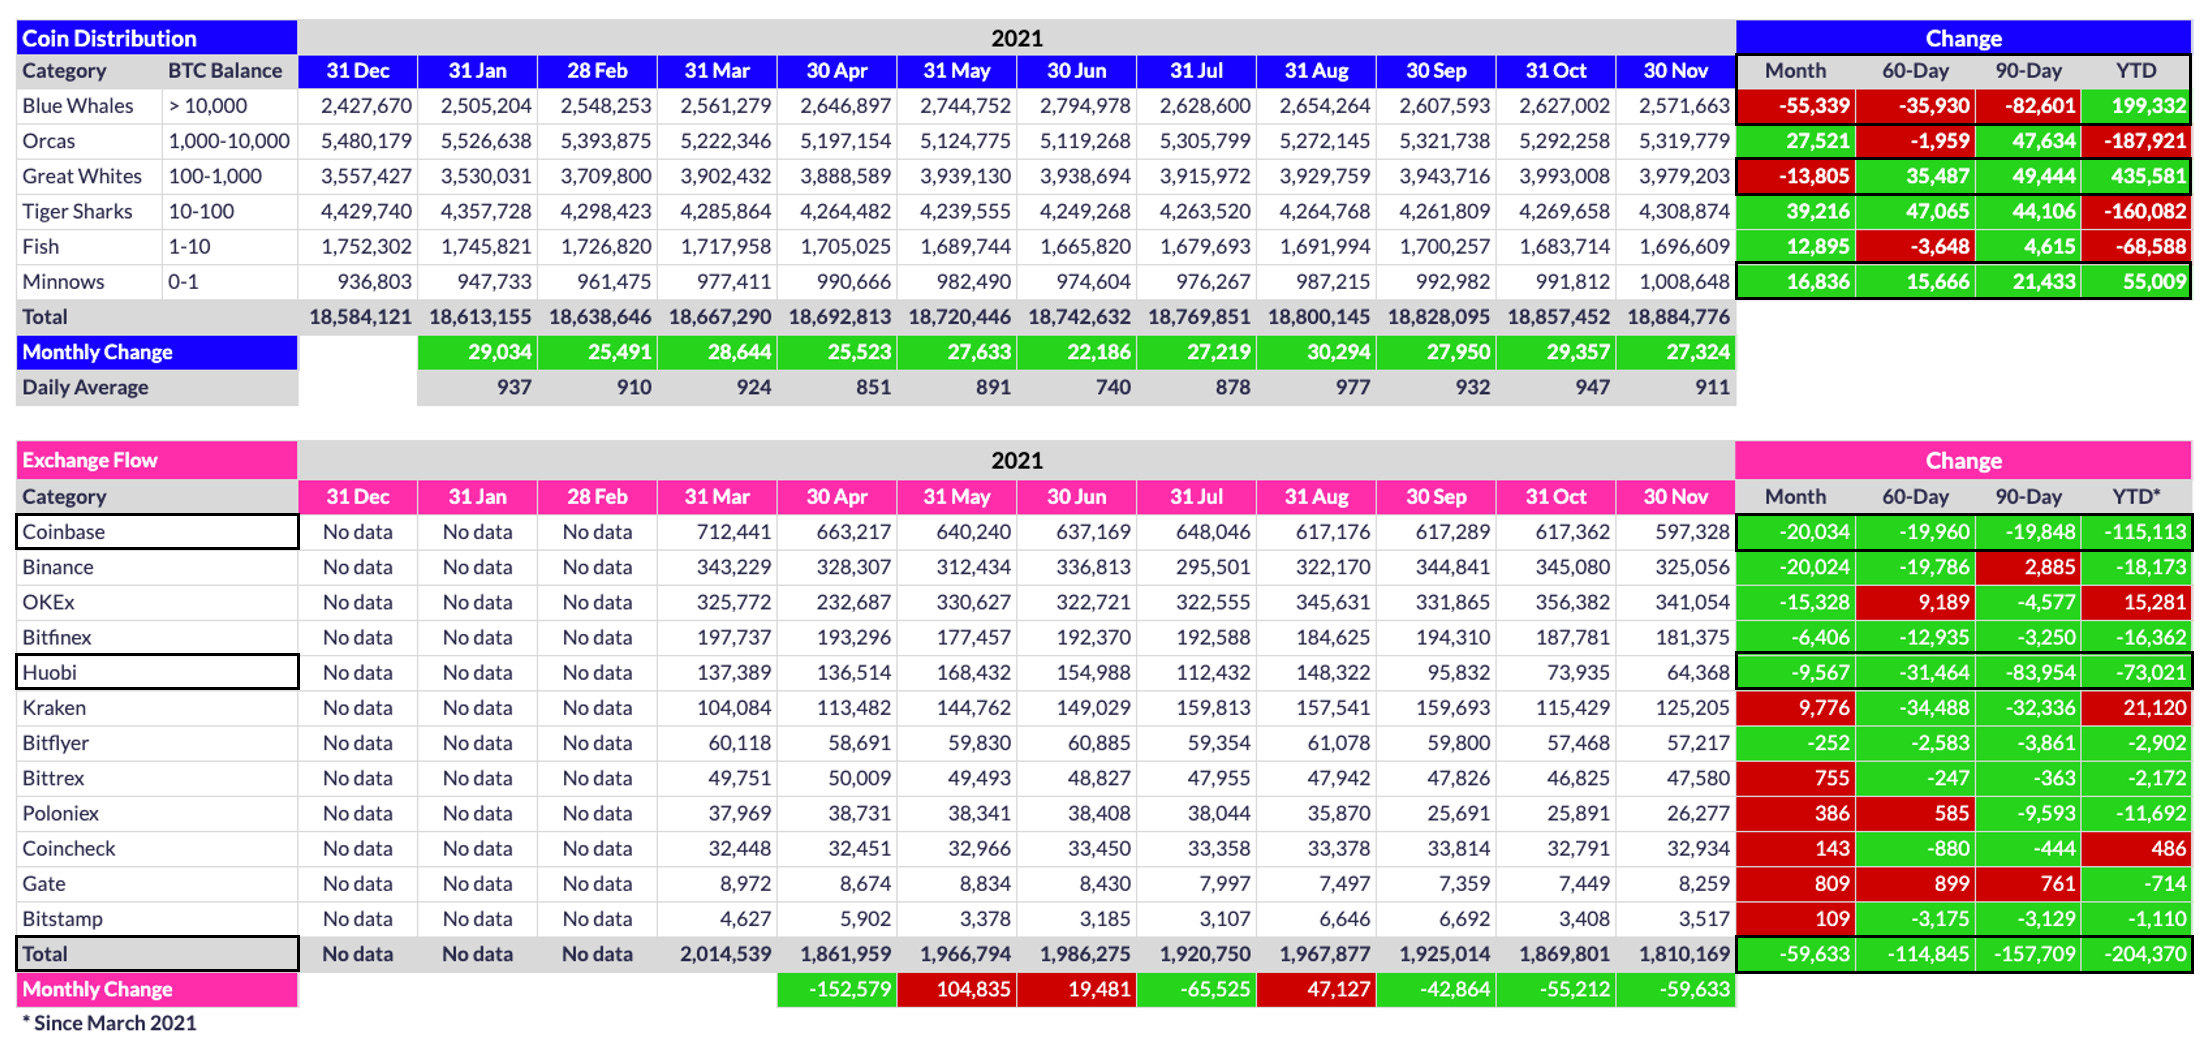
Looking at the on-chain data for the month, there was a HUGE surge in market participants in November, particularly among the Minnows. As shown below, a staggering 881.6K participants joined the network in November, the largest monthly increase since March. The month also closed at a new ATH (39.558M participants), with a total gain of 6.144M participants thus far in 2021.
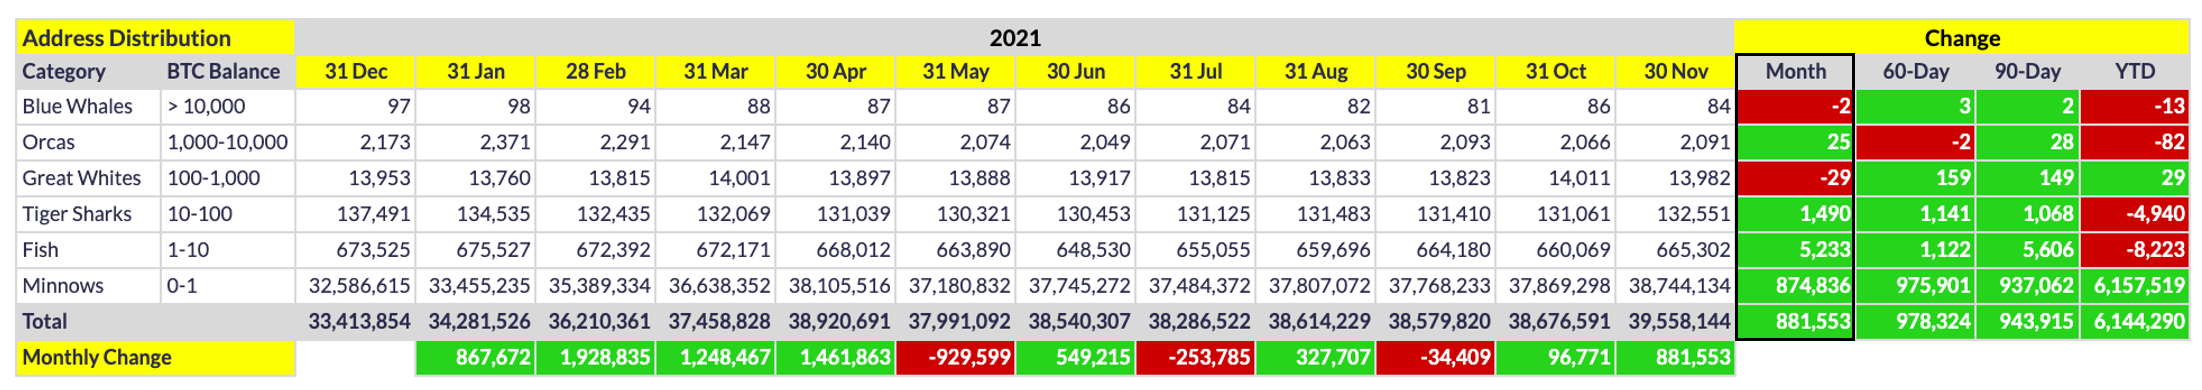
Note also the net increase of 23 Orcas in November (excluding the two devolved Blue Whales), which is critically important in terms of future PA for the reasons I explain here and here. While I will not recapitulate those articles here, see the chart below for further evidence that changes in Orca count reliably precede changes in price.
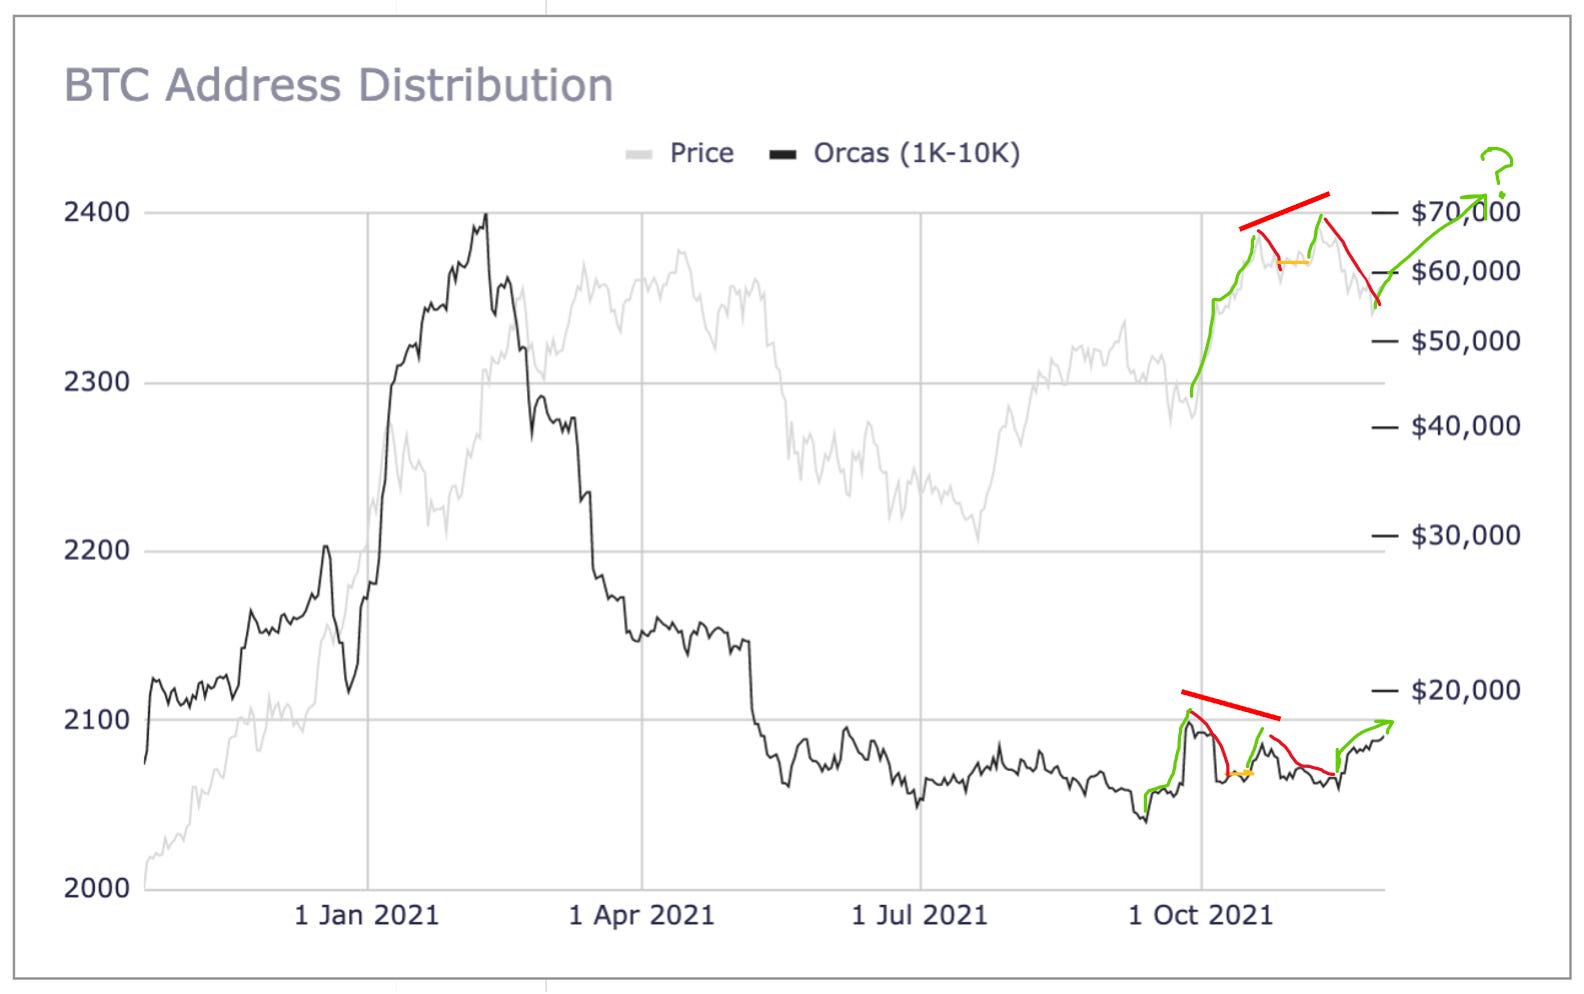
As shown above, the Orca surge that began September 23 led a surge in price starting September 29 (one week later), the Orca drop-off that started September 29 led to a price drop-off starting October 12 (two weeks later), the brief Orca surge from October 8-12 led to a brief price surge from October 15-20 (one week later), and then the steady decline in Orcas that started mid-October led the most recent price correction that started November 9 (three weeks later). Note also the bearish divergence that formed, with price rallying to a higher high in early November despite a lower high in Orca count mid-October. This is the first time I have seen such a divergence, but I plan to look for similar divergences going forward to see if they too, along with Orca-count changes per se, can help foretell future PA.
Speaking of which, also illustrated above (on the far right side of the graph) is the uptrend in Orca count over the past two weeks, from a recent low of 2060 on November 15 to a recent high of 2091 yesterday (November 30). Because of this uptrend, I believe we will see a commensurate rise in price soon, sometime in the first half of December. Whether it continues to climb beyond that will depend on how Orca counts change between now and then.
NB: I am aware of all of the reasons address counts should not reliably foretell PA (e.g., whales splitting stacks across wallets for privacy and/or security, the existence of aggregator wallets and exchange wallets, etc.), but the data are clear. Address counts, and Orca counts in particular, have reliably foretold PA for the past 12 months. You are welcome to believe otherwise, but the trend is clear even if counterintuitive.
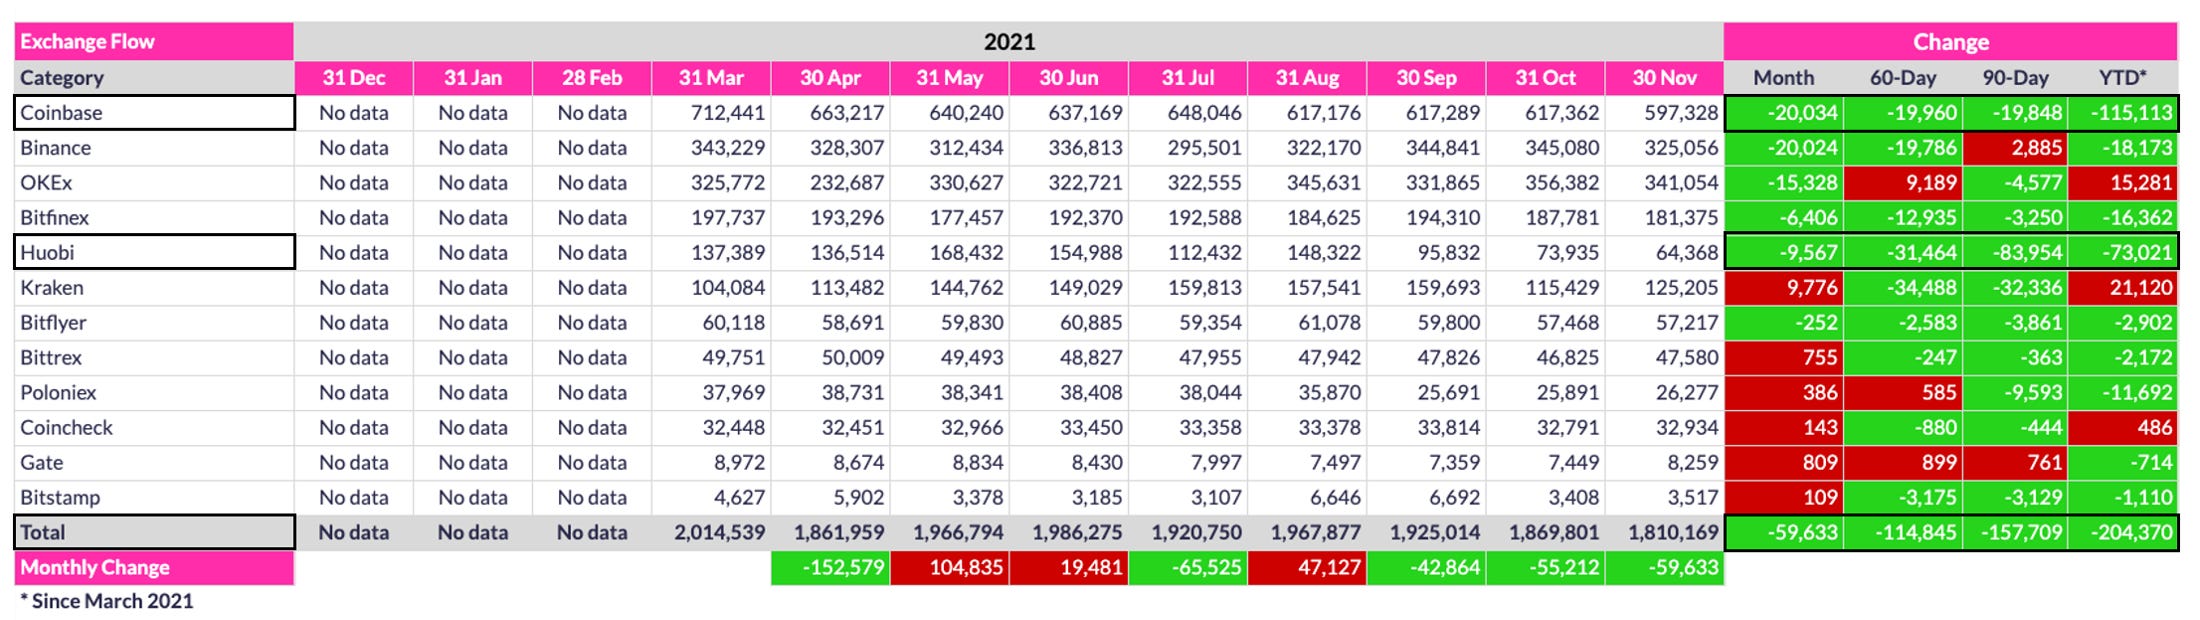
Beyond address trends, there are also some notable coin distribution trends. First, as shown above, Coinbase and Huobi account for a staggering 92% of the listed exchange outflows since March (i.e., 188.13K of 204.37K). I am not sure what we can infer from this finding, but it is interesting nevertheless.
Second is the size of the overall exchange outflow: 204,370 coins since March, with 59,633 coins in November alone. To put that in perspective, more than 1% of BTC’s total circulating supply has been pulled off these exchanges in the past eight months alone. While such a drain of circulating supply will not necessarily have an immediate impact on price - there are, after all, still 1.81M coins sitting on these exchanges - the long-term trend is clear. More and more buyers are hodling rather than speculating. As such, there will inevitably come a tipping point where demand outstrips available exchange supply, and when that day comes, price will skyrocket. The only question is when. I would argue that no one has any idea, but come it will, and when it does, PA at that time will be a sight to behold.
It is also important to look at exchange flows juxtaposed with investor tier holdings, particularly Blue Whales (BWs). For example, Binance and Bitfinex have the two largest wallets in existence, with 288K and 168K coins, respectively, and four of the five largest wallets have been identified as exchange wallets (NB: ownership of the third largest wallet is disputed, with some claiming it is Robinhood’s wallet, but after monitoring this wallet’s inflows and outflows for the past nine months, I continue to believe it is a private wallet.)
In any event, as shown above, BWs shed 55.3K coins this past month and 82.6K coins over the past 90 days, which on the surface could seem like whales are selling. Note, however, that BWs have accumulated 199.3K coins since March, peaking in June at 2.795M coins. So, how do we reconcile these data? First, note that the number of coins now held by BWs (2.572M) is back to levels last seen at the end of March (2.561M). i.e., Coins flooded onto exchanges in May and June during the steep mid-year correction, which accounts for the 199K net gain in coins since March, but they started flowing back off exchanges in July, when non-exchange whales started reaccumulating near $30K. Therefore, even with an exchange inflow in August, exchanges have by and large had outflows since July, which is why recent BW inventory is dropping.
Two other interesting coin trends are the huge accumulation among Great Whites (GWs), totaling 435.6K coins since March, as well as the huge Minnow accumulation in November (16.8K coins). This gain accounts for 75% of all Minnow accumulation over the past 90 days and almost one-third of all Minnow accumulation since March.
Finally, note that coins generally moved down chain in November, with the largest accumulation among Minnows, Fish and Tiger Sharks. While this could be interpreted as evidence of retail FOMO, the 59.6K exchange outflow in November suggests to me that many recent retail investors are would-be hodlers rather than speculators because they are moving their coins into cold storage rather than leaving them on exchanges. This is a great sign long-term because such hodling helps provide price-floor support during swoons even if such purchases do not necessarily drive price higher in the near term.
Conclusion (aka, Rant)
I will conclude this monthly analysis with a rant about a lot of the most popular content available on platforms like YouTube and Twitter. None of the following is financial advice, but here is some food for thought as you too try to ascertain where BTC’s price is headed next:
1) This cycle has not been “lengthened.” Every cycle is programmatically designed to last +/- four years (or 210,000 blocks, more specifically). This cycle is no different.
Now, if by “lengthened” one means the cycle peak will be reached at a point later in the halving cycle than in cycles past, fine. Then state so more clearly. But even this conclusion is based on the faulty assumption that the 4-year halving cycle is still relevant. Make no mistake. I too once believed that halvings still mattered, but it has become abundantly clear over the past 12 months that they do not.
Put another way, the whole reason halving cycles mattered in the past is because miners used to be the primary source of sell pressure, so the fewer the coins they mined, the fewer the coins they could release into circulation. In the current environment, however, it is misguided to think that miner selling is the primary source of current (or future) sell pressure. For example, when was the last time you heard about miners “dumping?” It has been at least seven months since I last heard such a claim, and such claims would be even more baseless now given that so much of the hash rate has moved out of China and into the US. i.e., The business model of the most dominant miners (e.g., $MARA) is to hodl rather than sell, so the primary sell pressure now is from large holders other than miners.
All of this is to say that the 4-year cycle has been broken. So no, there is no lengthened cycle; there is no more cycle, period, at least in the 4-year halving cycle sense. Instead, because of increased institutional involvement, what we will see heretofore is a series of bull and bear phases, just like any other market, irrespective of the halvings. Yes, each halving event will undoubtedly be celebrated, particularly by the Old Guard, but their impact on PA will be minimal (or at most temporary).
In short, if by lengthened cycle one means a new all-time high will be reached before the next halving date, then yes, they are likely correct simply because BTC’s price goes up more often than it goes down. However, the idea of PA conforming to a 4-year cycle based on the halvings is anachronistic. Each new halving, including the most recent one, merely reduces an already small new supply, so any selling by miners either now or in the future is largely irrelevant. So too then is the notion of a supply shock due to a halving.
2) Anyone citing waves, fractals, rhyming history or any other kind of indicator based on past-cycle PA is doing a tremendous disservice to the average retail investor because they induce unrealistic hopes that have proven wrong REPEATEDLY.
If we are to uncover any insight at all into future PA, it is through on-chain data, and even that source of data is now of limited utility thanks to derivatives markets, not to mention the inconsistent reporting of on-chain data (see again my disclaimer at the start of this newsletter). Regardless, as I have said dozens of times now, if we are to see a parabolic price spike at any point in the future, it will be preceded by a sudden and steep increase in the number of new whales. As illustrated above via this month’s data, we in fact are seeing increased whales participation at the moment, but NOTHING like that of late 2020 and early 2021 (the last time price spiked substantially and sustainably). Without a comparable surge in whale numbers, there will be no parabolic price spike, at least nothing sustainable. As always, the only thing that can cause a parabolic price spike is FOMO and BTC’s market is decidedly absent of that right now (thankfully). Moreover, unlike in 2013 and 2017, when retail FOMO was able to move price parabolically, institutional FOMO is now required because of how much each coin costs. Remember, one Orca has the purchasing power of nearly 100,000 Minnows. Think about how staggering that statistic is.
Still not convinced? Look again at this month’s data. November experienced the largest increase in Minnows in six months, and yet what happened to price? It dropped 7.2%. Why? Because their total combined purchasing power is equivalent to only a handful of Orcas. Again, there will no be parabolic spike in price until/unless Orcas once again start multiplying like wet Gremlins. And for that to happen, there will need to be a meaningful catalyst. Not some bullish billionaire tweet, but a true Game-Theory-inducing catalyst. The only such catalysts I can foresee are: 1) a physically settled BTC ETF getting approved in the US; 2) an announced purchase that comes out of left field, one that makes other companies (or countries) finally sit up and take notice; or 3) some direct strike to the value of the USD, which would likely take BTC down with it initially but which would finally lead to a full decoupling, where more people start piling into BTC because of its scarcity, fungibility, transportability, sovereignty, etc., rather than because it is a high-risk, high-reward growth asset. In short, we need more big investors buying and hodling Bitcoin rather than trading it, and that simply is not happening yet, as I explain here.
In the absence of one of more of these catalysts, BTC’s price will “only” slowly grind higher over time. But honestly, for the hodlers among us, that is what we should hope for anyway, as opposed to some insane parabolic spike that inevitably leads to a painful mean reversion shortly thereafter. Such volatility sets wider BTC adoption back weeks, months, even years.
Look at it this way: BTC is a finite asset with a programmatically reduced rate of inflation. Price WILL go up over time. It is a mathematical certainty, provided of course its network effect, Lindy Effect, Metcalf’s Law, etc. continue to apply to BTC like they have to so many other technological innovations over the past 20 years. And we can track those effects via on-chain data. But does that mean we will necessarily see a parabolic spike this halving cycle simply because there were parabolic spikes in previous halving cycles? Absolutely not. Could such a price spike still happen this cycle? Absolutely. But again, it would require a very potent catalyst, a catalyst that causes a surge in institutional demand, not retail demand. Time alone is certainly no such catalyst nor are fractals or any other projections based on past-cycle PA.
Long and short, BTC’s market is so markedly different now, whatever happened in prior cycles is completely irrelevant. This cycle isn’t like 2017, nor even 2013, as even I tried to argue in the past. The only thing similar between now and past cycles is that price is still ultimately a reflection of human sentiment. So yes, there will be periods of bullishness and bearishness forever more, some more extreme than others, but these periods will be induced by the events of the time, NOT because past cycles were bullish or bearish at some point equivalent to the current halving cycle.
3) Given my views above, the only model that still seems worthwhile is PlanB’s stock-to-flow cross-asset (S2FX) model. While modeling price based on halving cycles no longer seems valid, his S2FX model is not time-dependent; it strictly models scarcity. Most importantly, and unlike literally every other model out there, it interpolates BTC’s future price based on known values of other finite assets, NOT past PA. In short, the S2FX model is completely devoid of speculation. Because BTC’s scarcity will increase over time, so too will its price. It is a mathematical certainty, again provided that its network effect, Lindy Effect, Metcalf’s Law, etc. remain applicable to BTC like they have to every other technological innovation of the past 20 years.
I am so convinced that BTC will eventually reach its current modeled S2FX price of $288K, the only question is when. But again, trying to predict timing is a fool’s errand because so many exogenous factors influence price, and never more so than now given the level of institutional involvement in the market. But BTC will undoubtedly reach its S2FX price eventually. In that projection, I have no doubt.
With all this said, it seems to me that the most prudent thing to do is to just stack sats and otherwise sit tight and wait for the protocol to fulfill its programmatic destiny. And for all that is good in the world, if one insists on repeatedly jumping into and out of a market, then at least do so in something other than BTC. i.e., Hodl BTC and trade alts. Anyone trading BTC at this point is wielding a knife in a gun fight, in my opinion. It simply doesn’t make any sense. Altcoins are the only crypto markets with enough short-term volatility to make trading consistently profitable, and even then, only in the most skilled hands. But again, that is just my two sats.
As always, good luck with your own investing, and of course…
Go BTC.
Another brilliant article. Thanks for the effort David!
Mic drop!