
Address & Coin Distribution Analysis
Address & Coin Distribution Analysis
January 2021

Introduction
Below is a table illustrating changes to the distribution of active Bitcoin (BTC) addresses and coins for the month (NB: the distro table is posted throughout the article to minimize the need to scroll).

The table legend is as follows:
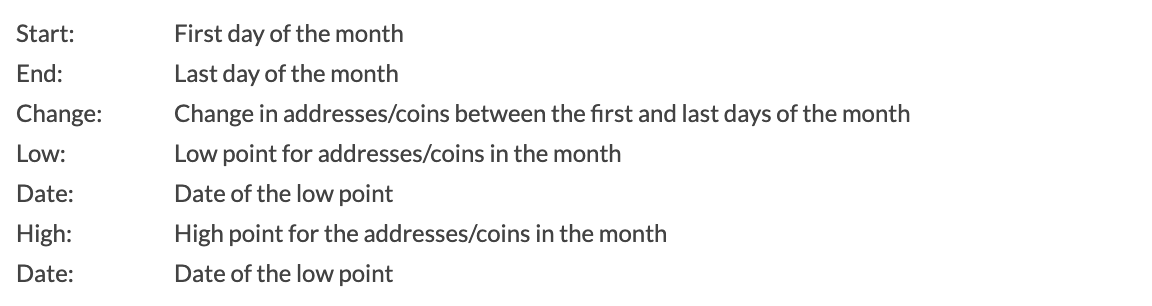
Analysis
January 2021 saw an all-time high (ATH) daily close of $40,665 on January 8 (using Coinbase data), swooning 25.3% thereafter to a post-peak low daily close of $30,407 on January 27. Nevertheless, BTC still ended the month up 15.7% after opening at $28,990 and closing at $33,533.
Given the volatile price action (PA) during the month, it is unsurprising there were significant changes within and across groups, both in terms of active addresses and coin distribution. As shown, two new Blue Whales emerged during the month, which is great in itself, but what is most staggering, IMO, are the 199 new Orcas and nearly 1M (967K) new Minnows that emerged throughout the month. Perhaps even more importantly, both groups ended the month at/near all-time highs. In other words, despite the ATH being reached on January 8, followed by a precipitous price drop over the next several days, both retail and institutional demand increased nearly continuously throughout the month. This is incredible.
To put institutional demand in perspective, there were 199 purchases of no less than $35M each (1000 BTC @ $35K each). Given that the Orca pod added a total of 47.4K coins during the month, however, the average Orca address now has a value of $81.6M (5,526,638 x $35K / 2.371), which is FAR in excess of the minimum $35M value per address. In short, the wave of institutional investment we keep hearing about is clearly beginning to arrive on Bitcoin’s shores, and I expect to see it only increase from here, and potentially exponentially so.

The number of new Minnows also demonstrates that retail-fueled FOMO began in earnest during the month. Interestingly, however, it only partially correlates with the sprint to the intraday ATH of $42K. As the table data illustrate, retail demand actually peaked on January 30, a full three weeks post-peak. This indicates, IMO, that the inflation-hedge/store of value narrative surrounding BTC is picking up steam. Combined with increasing interest in Decentralized Finance (DeFi) due to the recent GameStop ($GME) short-squeeze drama that nearly wiped out a huge Wall Street hedge fund, retail interest in and demand for BTC and other cryptocurrencies continues increasing daily, almost irrespective of daily price changes. Elon Musk’s recent Twitter bio change no doubt helps as well.
Stated differently, there is no question the parabolic spike to a new ATH on January 8 increased interest in BTC during the month, but this interest has actually accelerated since, which is pretty remarkable given the equally newsworthy 25% swoon following the ATH. Therefore, just as institutional demand will very likely continue increasing in the months ahead, so too will retail demand. And given that new BTC stock is being mined at an average rate of only 904 new coins per day (see the bottom cell in the table), there really is only one place for price to go, and that is up.
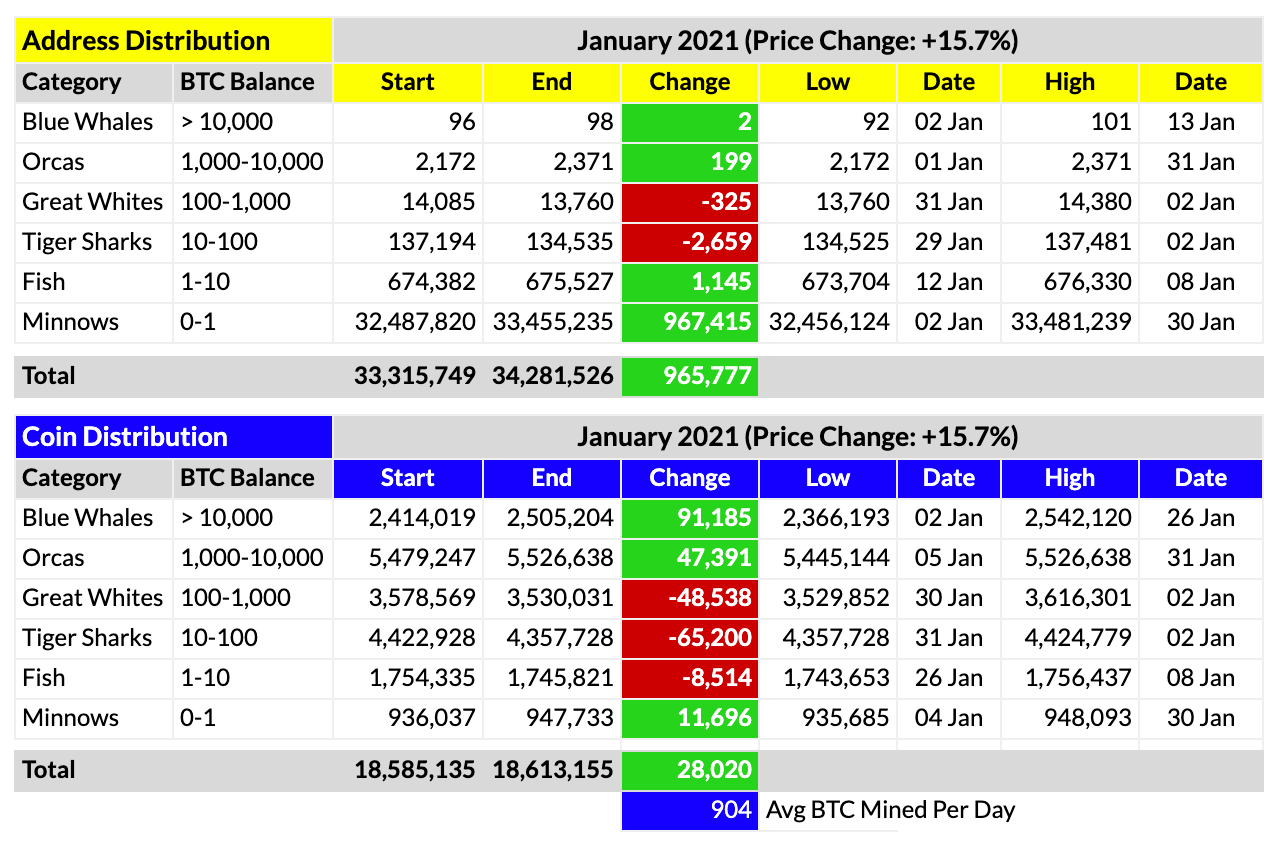
One other noteworthy highlight in the data is the gutting of the mid-tier investors during the month. As shown, there were big drops in the number of active Great Whites & Tiger Sharks, with the two groups shedding a staggering 114K coins combined. Fish experienced an even more polarizing swing within its school, where it added 1,145 new addresses but shed 8.5K coins, meaning the average number of coins per Fish address dropped considerably during the month.
While I need to continue studying these mid-tier changes (in combination with other market data) to form a more concrete opinion, my current thesis is that these middle tiers are inhabited primarily by traders and wannabe HODLers (“investors” who FOMO in with the intention of HODLing but ultimately FUD out because of their lack of conviction and/or inexperience with the type of volatility a high-growth asset like BTC exhibits). One prime example is NexTech AR Solutions, which FOMOed into BTC in late December and early January, but then FUDed out only a few weeks later. NexTech’s position size put it in the lower end of the Great White group. I suspect there were many other mid-size institutions (or high-net-worth individuals) who did much the same in the runup and subsequent swoon that we experienced this month.
Conclusion
In short, demand for BTC, both among retail investors and institutional investors, is growing rapidly. Combined with BTC’s disinflationary protocol, it is merely a matter of time before price goes up. A lot. There really is no alternative. You cannot increase the numerator of a fraction while holding its denominator near-constant and get anything other than a higher number for is product. Hence the “number go up” meme spreading like wildfire throughout CryptoTwitter (CT) these days.
Housekeeping
Some of you who follow my daily address/coin distribution tweets might notice that I have eliminated the “Neo” category here in this monthly summary table. I previously, mistakenly, had assumed that the one lone address with greater than 100K coins was either an unshakable HODLer (potentially Satoshi) or in a wallet with a lost set of keys. However, on January 28, and for the first time since I began tracking these data, a second Neo emerged. Curious about the change, I began perusing the data, address by address, only to discover that both Neo addresses are actually cold storage wallets for two exchanges (Huobi and Bitfinex). Upon further investigation, I discovered that a handful of the Blue Whale addresses, unsurprisingly, are held by exchanges. Therefore, increases in Blue Whale addresses could be either bullish or bearish, depending on which address joins or leaves the pod. For example, with Bitfinex adding to its cold wallet, that would suggest an exchange inflow (an increase in exchange stock that could potentially be added to the overall float available for purchase). This type of Blue Whale address is therefore neutral at best and bearish at worst if it increases in the number of coins held in it. On the flipside, if, e.g., MicroStrategy holds its coins in only one or two (or five) addresses, then an increase in this type of Blue Whale address would be bullish indeed. I therefore really need to see if I can determine what type of address joins or leaves the Blue Whale pod to determine whether the change is bullish or bearish. However, trying to make this determination via the data I have access to would be very laborious and potentially impossible. I will nevertheless try to the extent time permits. In the meantime, given what I have learned about the two largest addresses, I have decided to merge them with the Blue Whale category going forward because the distinction between these two groups is largely meaningless.
I guess that’s it for January. Let me know via a comment below or on Twitter whether you have any questions. In the meantime, Go BTC.
Thank you for clarifying the Neo situation...