
Disclaimer
The data I use (BitInfoCharts, Coinglass, CoinMarketCap) to compile the tables and graphs contained in the on-chain section of this analysis do not always align with data found via others sources like Glassnode and CryptoQuant. I cannot explain the reason for the differences nor can I confirm which sources are most accurate. For this and other reasons, I have come to trust only the on-chain data I collect when trying to explain and/or predict Bitcoin’s (BTC) future price action (PA). Whether you too find my on-chain analysis useful is for you to decide, but I can assure you that some of my observations and/or predictions will differ, often markedly, from other observations and/or predictions you will see on Crypto Twitter (CT) and elsewhere.
Price Action
Bitcoin had a sneakily bullish May, closing 11.3% higher despite gently grinding lower the final third of the month. After opening the month at $60,652 (on BLX), Bitcoin peaked at $71,893 on May 21 before closing at $67,495.
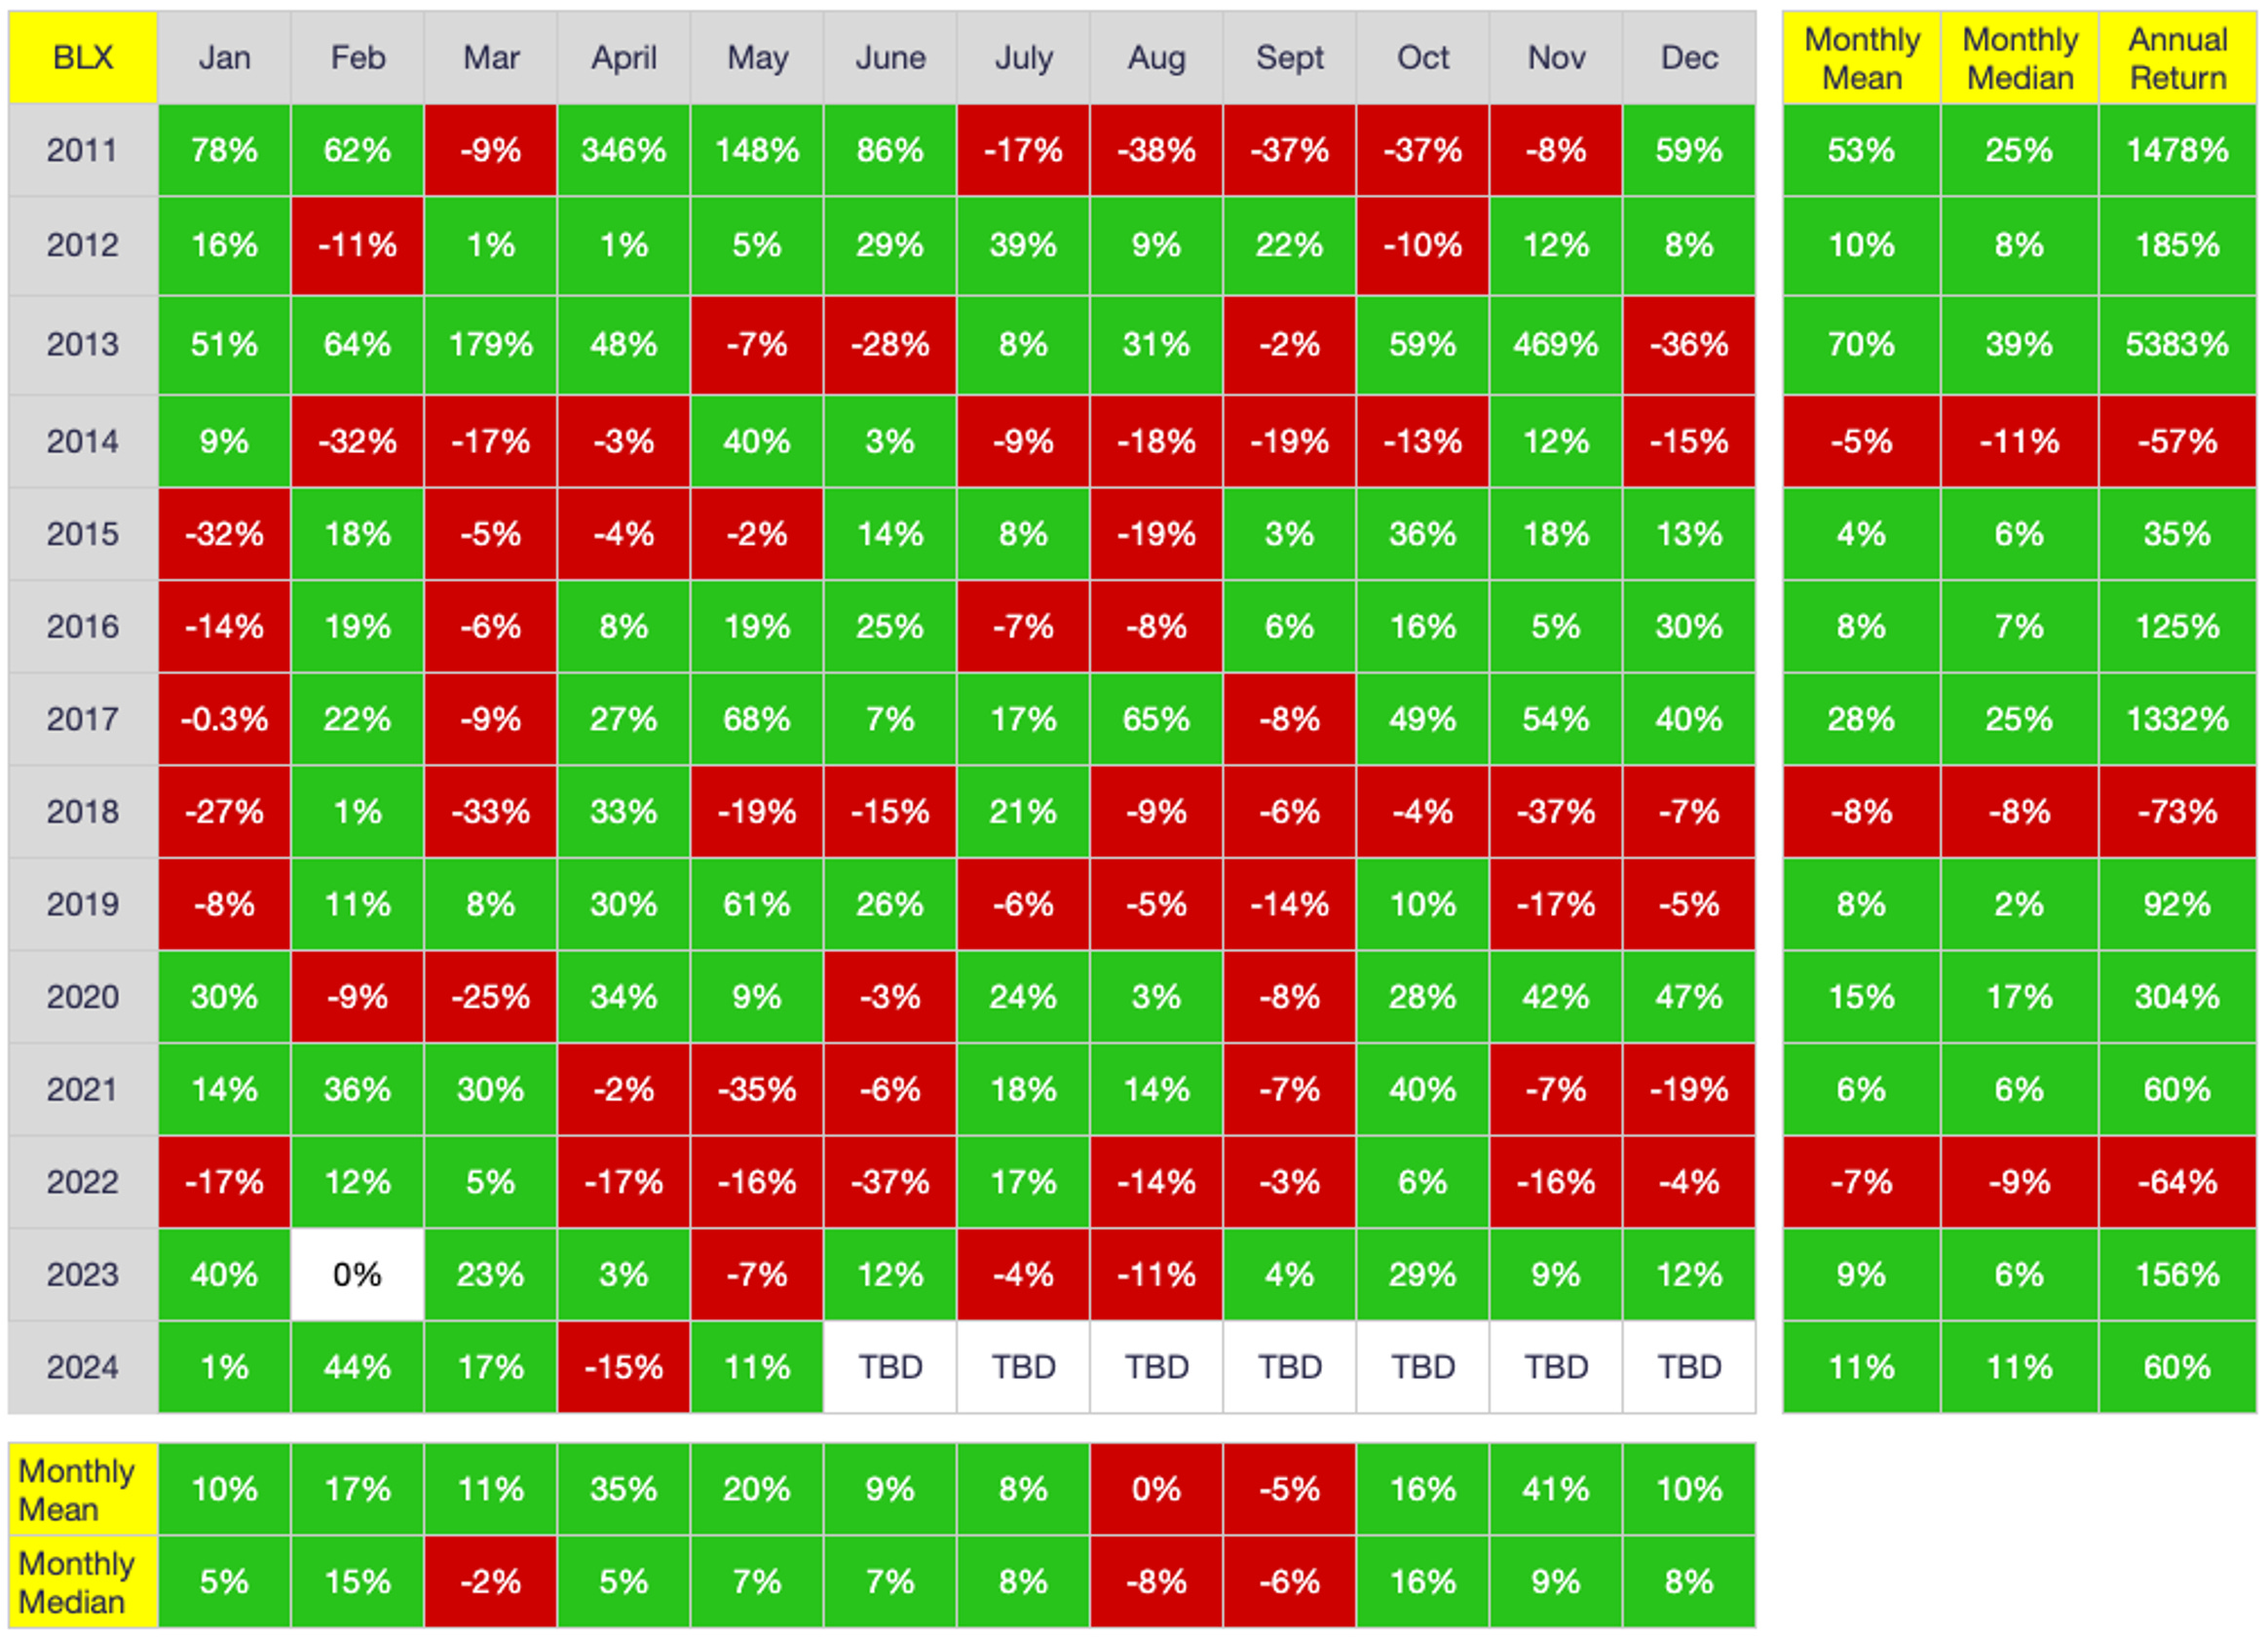
As shown above, May 2024’s higher close largely offset the 15% dip in April 2024 as well as ended a three-year run of lower May closes.
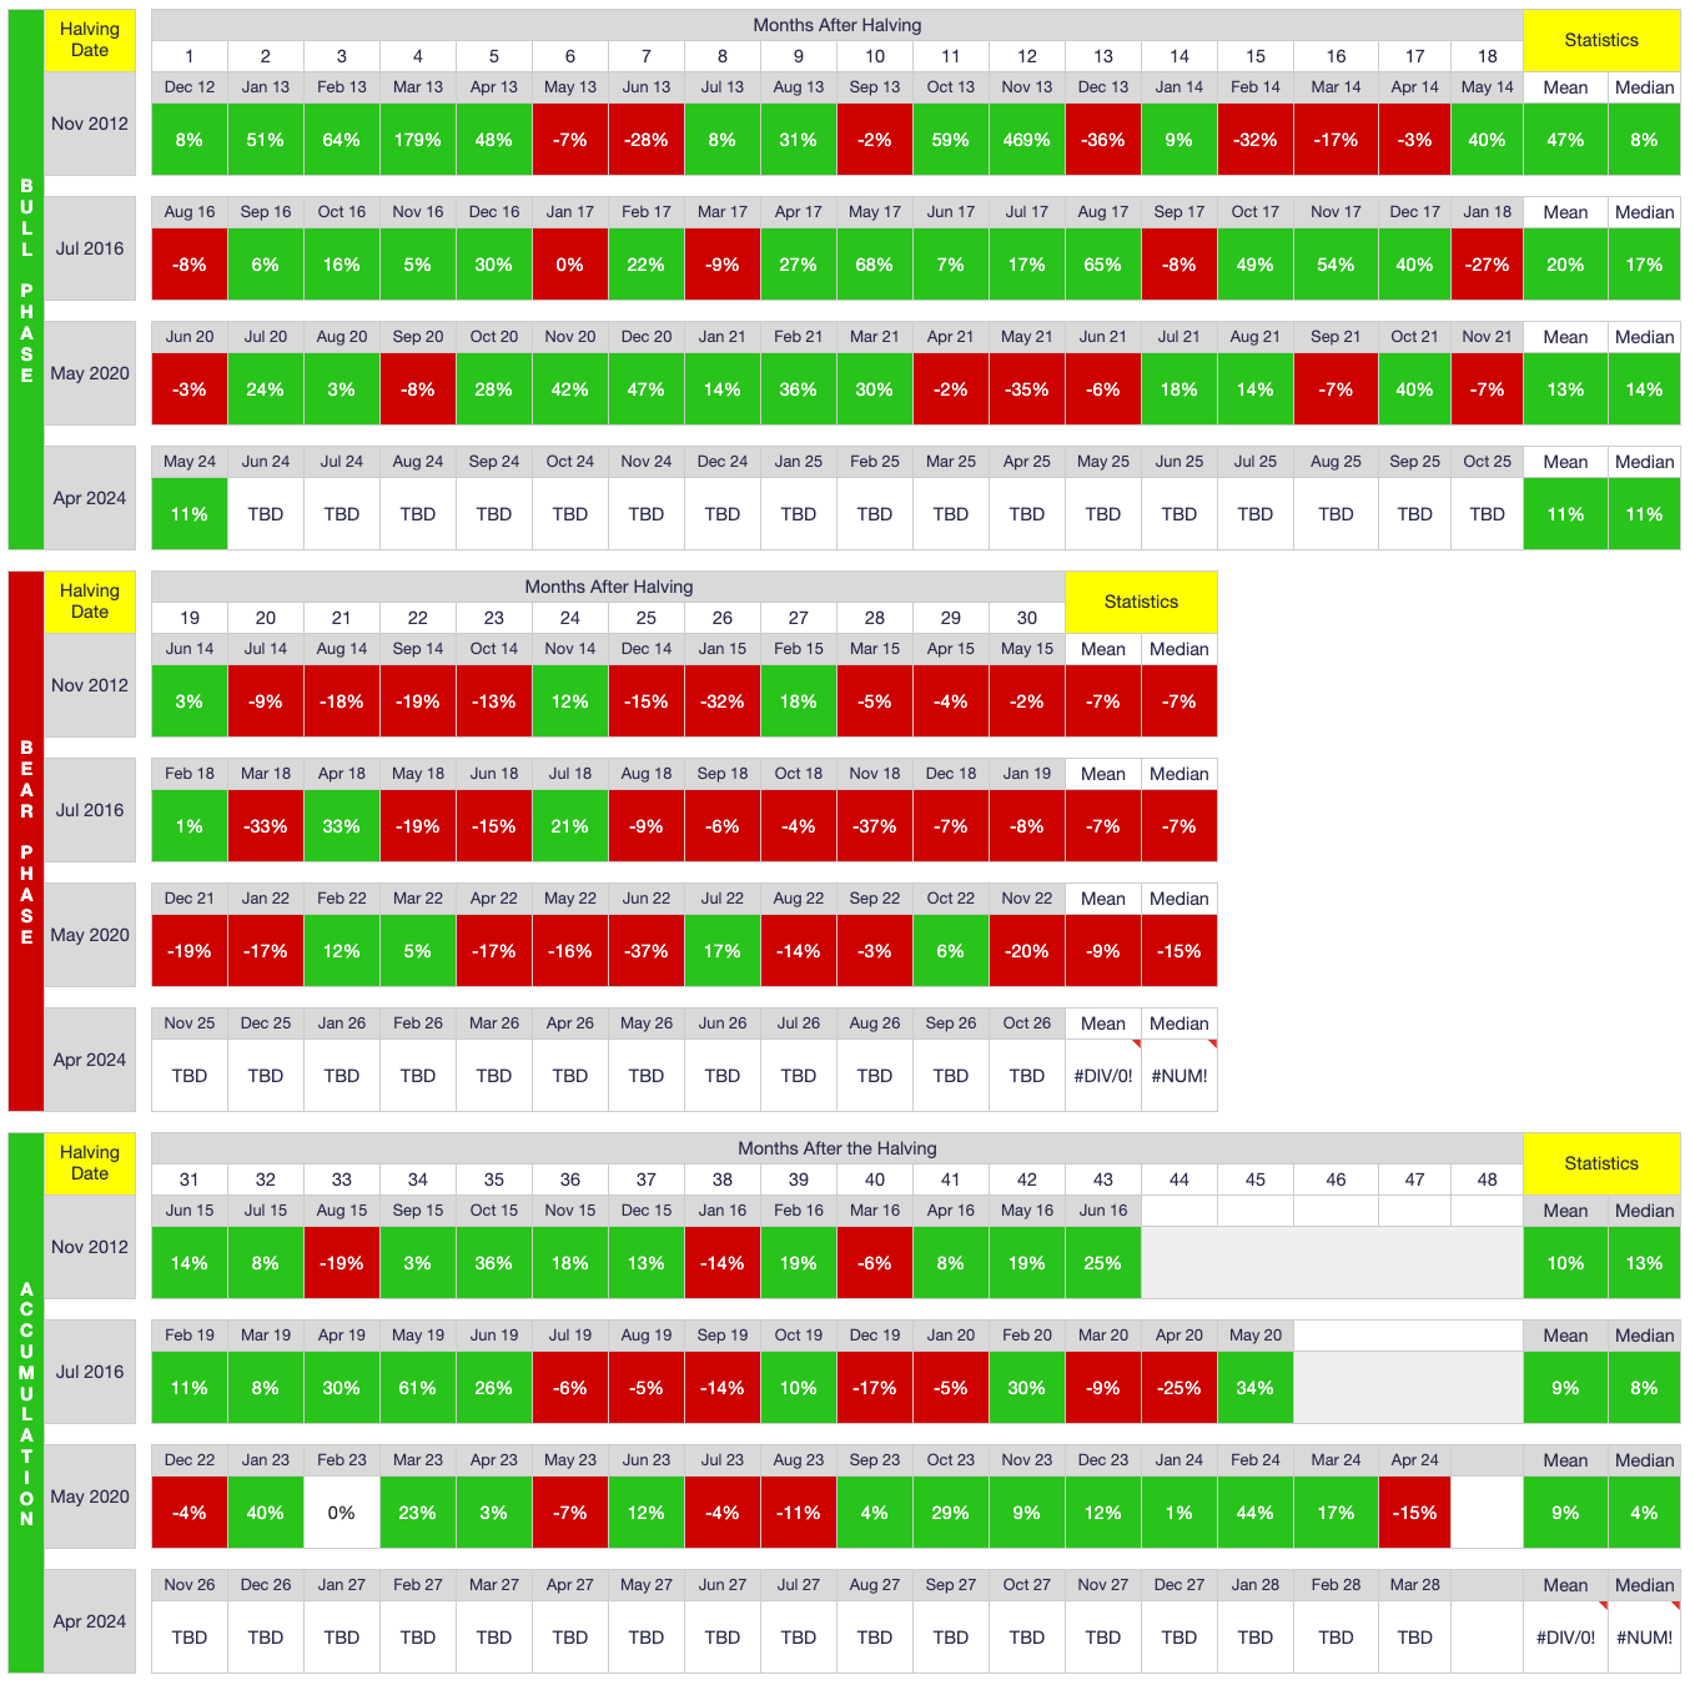
From a halving-cycle perspective, May 2024 is the first full month following a halving that has closed higher since December 2012 (as shown above, August 2016 closed 8% lower and June 2020 closed 3% lower).
In short, the nearly unprecedented bullish run of monthly closes continues, with the January 2024 approval of US Exchange Traded Funds (ETFs) undoubtedly the primary catalyst. Updates on US ETF flows are further below.
That said, not all is peaches and cream regarding current PA.
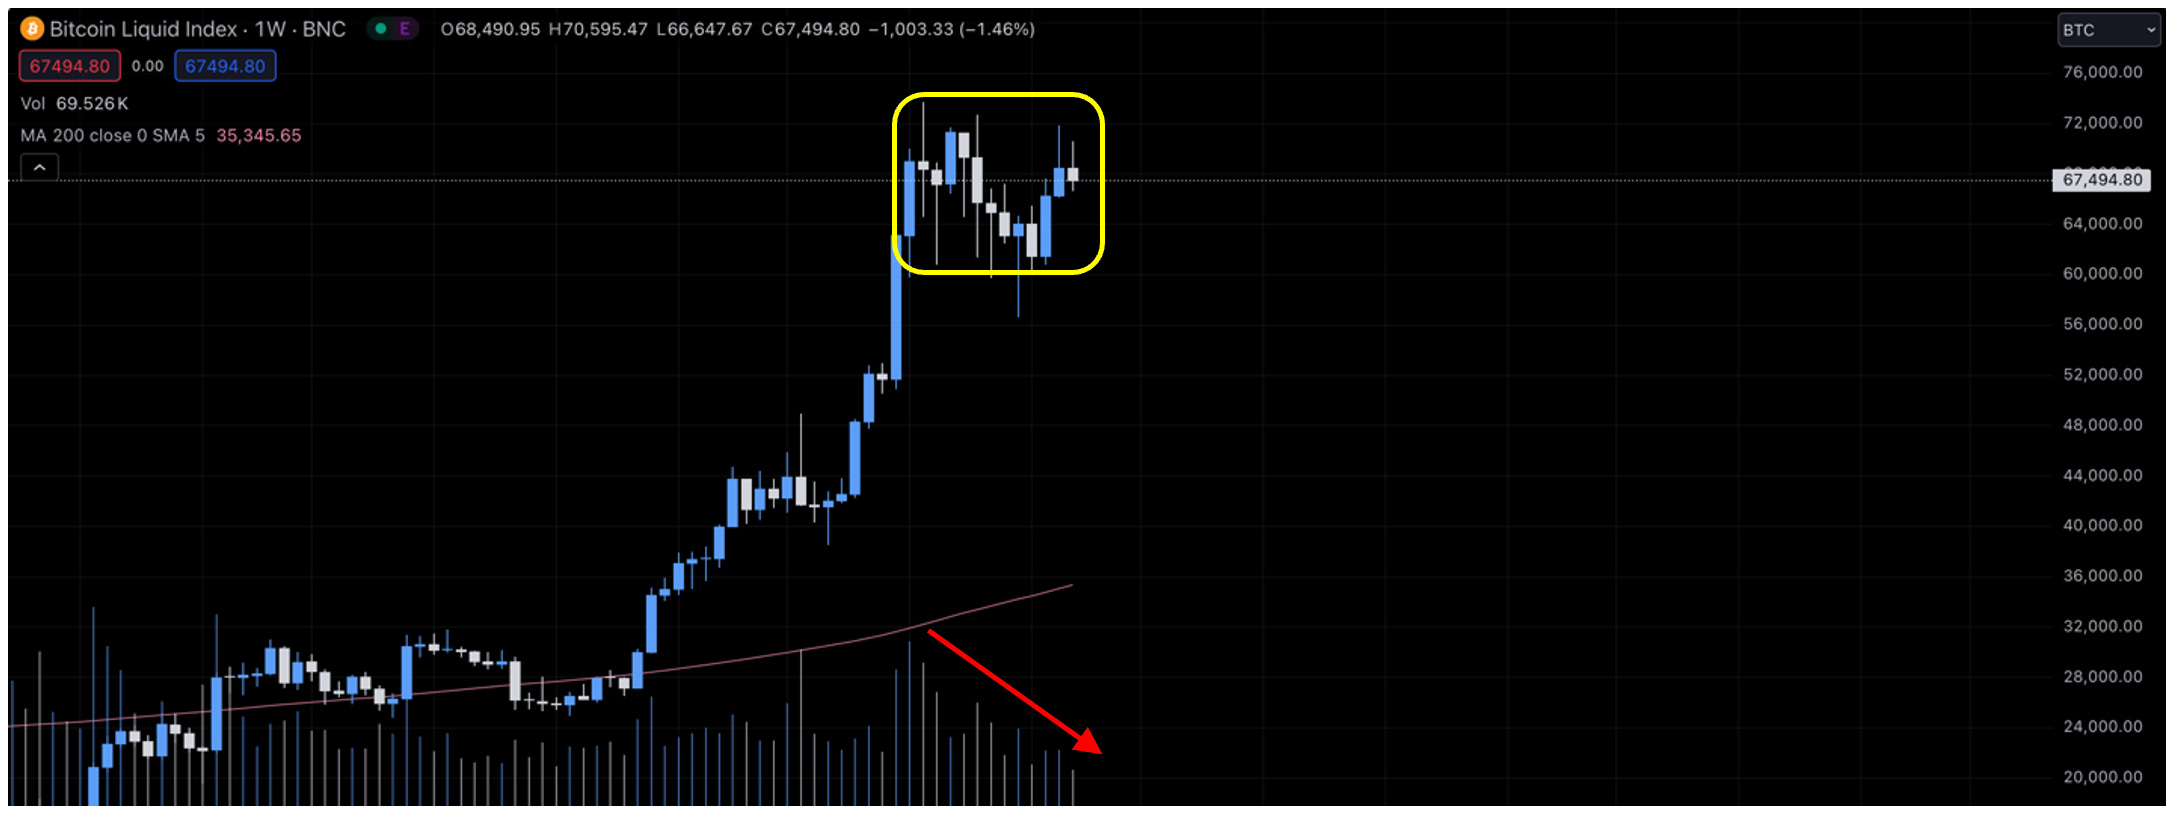
As shown above, nearly every weekly candle the past three months has closed with a sizable upper wick, meaning price has closed lower than the weekly peak nearly every week since the end of February. Moreover, spot volume has been on a precipitous decline since February (the first full month following the launch of US ETFs). To some degree, lower volume is to be expected following the initial rush into US ETFs, but the fact that volume is still declining three months later is obviously less than ideal. i.e., While the latest halving, which occurred on April 20, 2024, will undoubtedly prove to be a significant price catalyst eventually, it may take several months before that is the case. The good news is, such a delay is common each halving cycle, with the supply shock taking some time before it manifests itself via price.
Despite the relatively ugly weekly chart, the monthly chart is somewhat more encouraging:
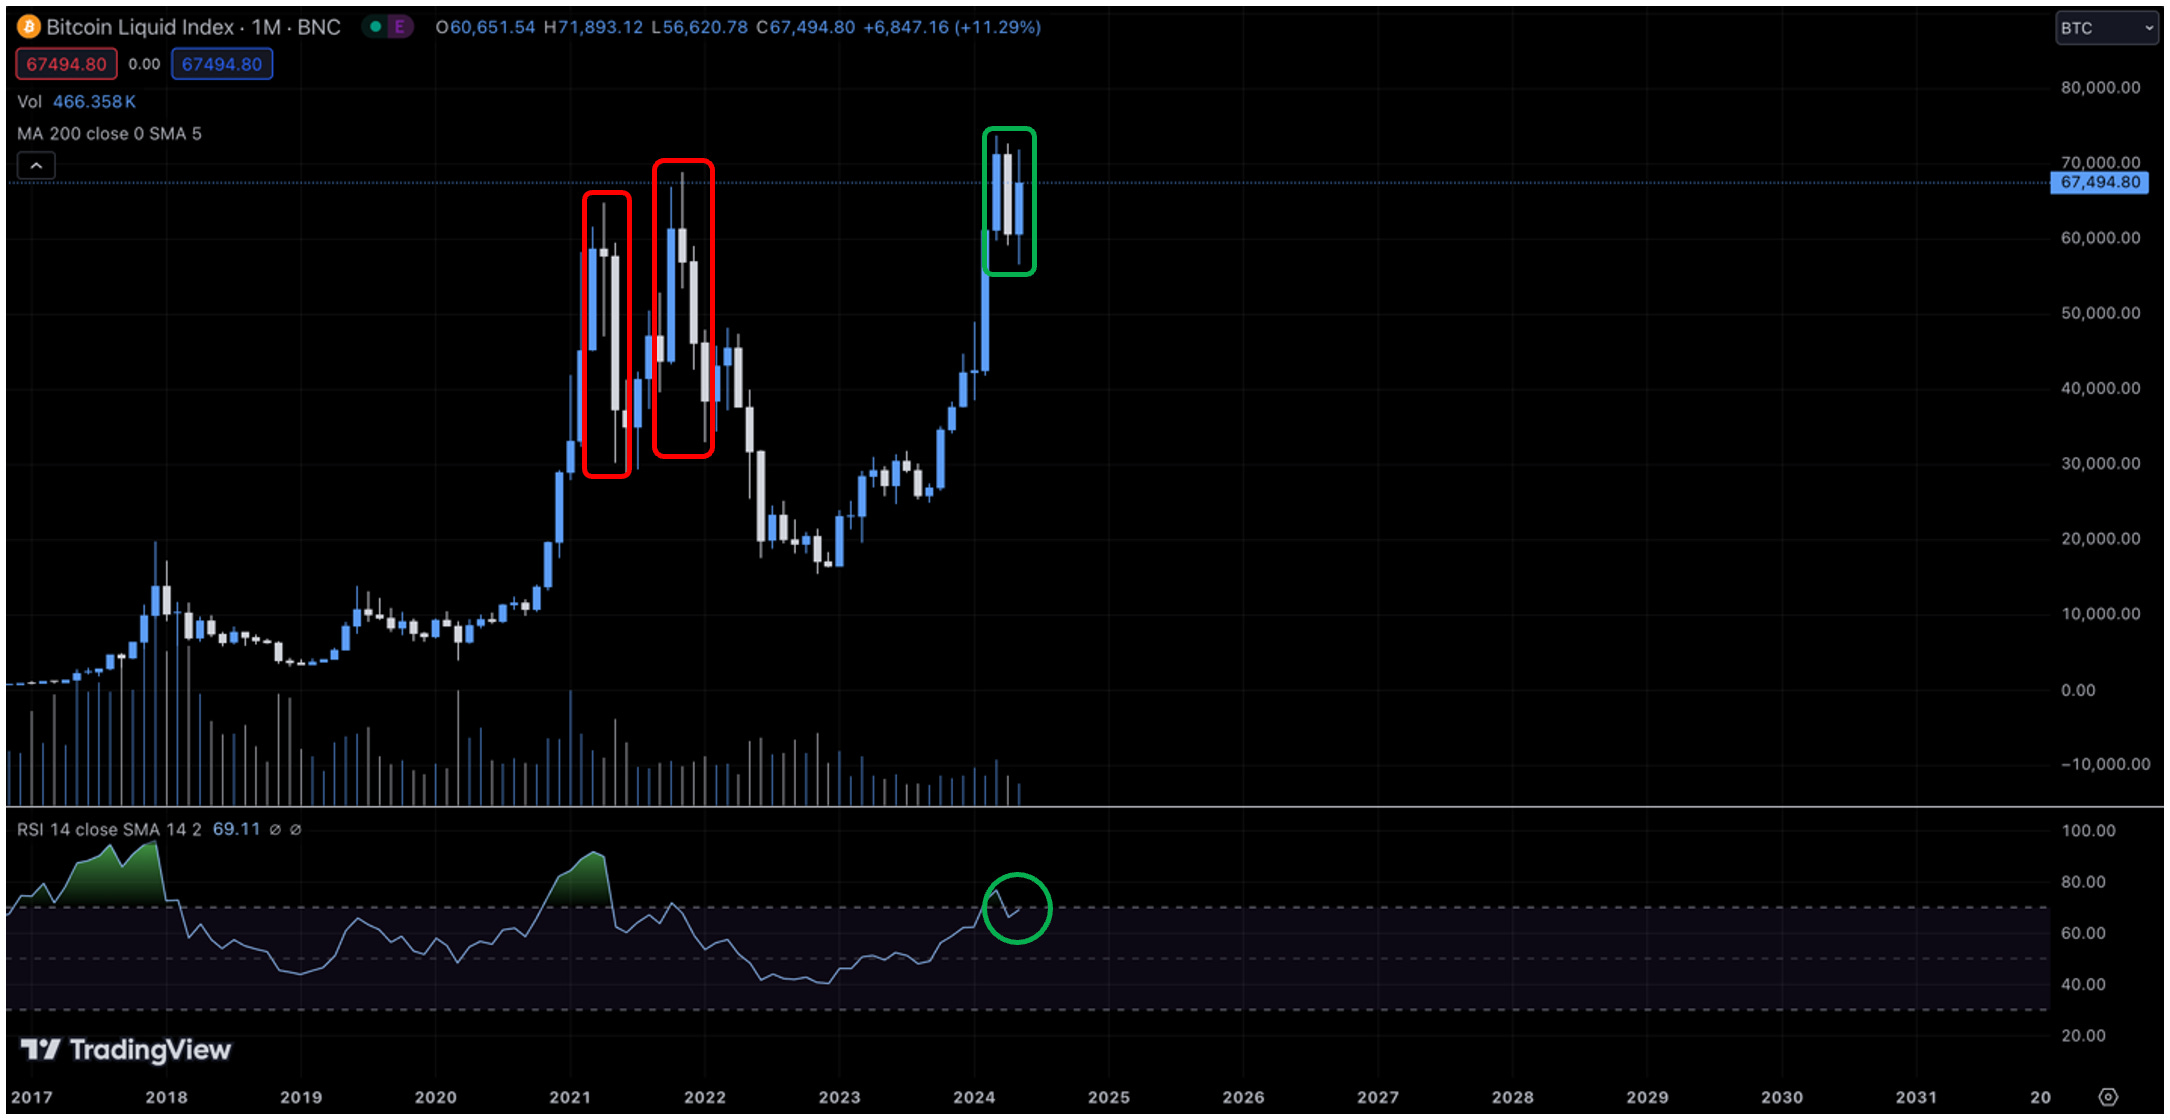
As shown above, May 2024 is the first time BTC strongly rebounded following a down month after hitting a new all-time high (ATH). Moreover, it appears the monthly Relative Strength Index (RSI) is about to reenter the “overbought” zone (green circle), which is (somewhat counterintuitively) bullish.
From a technical-analysis (TA) perspective then, June 2024 is an important month. If price closes higher yet again, particularly above the current monthly-close ATH ($71.3K), it will not only extend the nearly unprecedented run of bullish monthly closes, it would likely reverse the somewhat bearish weekly closes of late.
All that said, I personally pay little heed to TA, instead preferring to monitor changes in on-chain data when trying to determine where price may be headed next.
On-Chain Data
Below are the distribution of BTC addresses and coins the past 12 months:
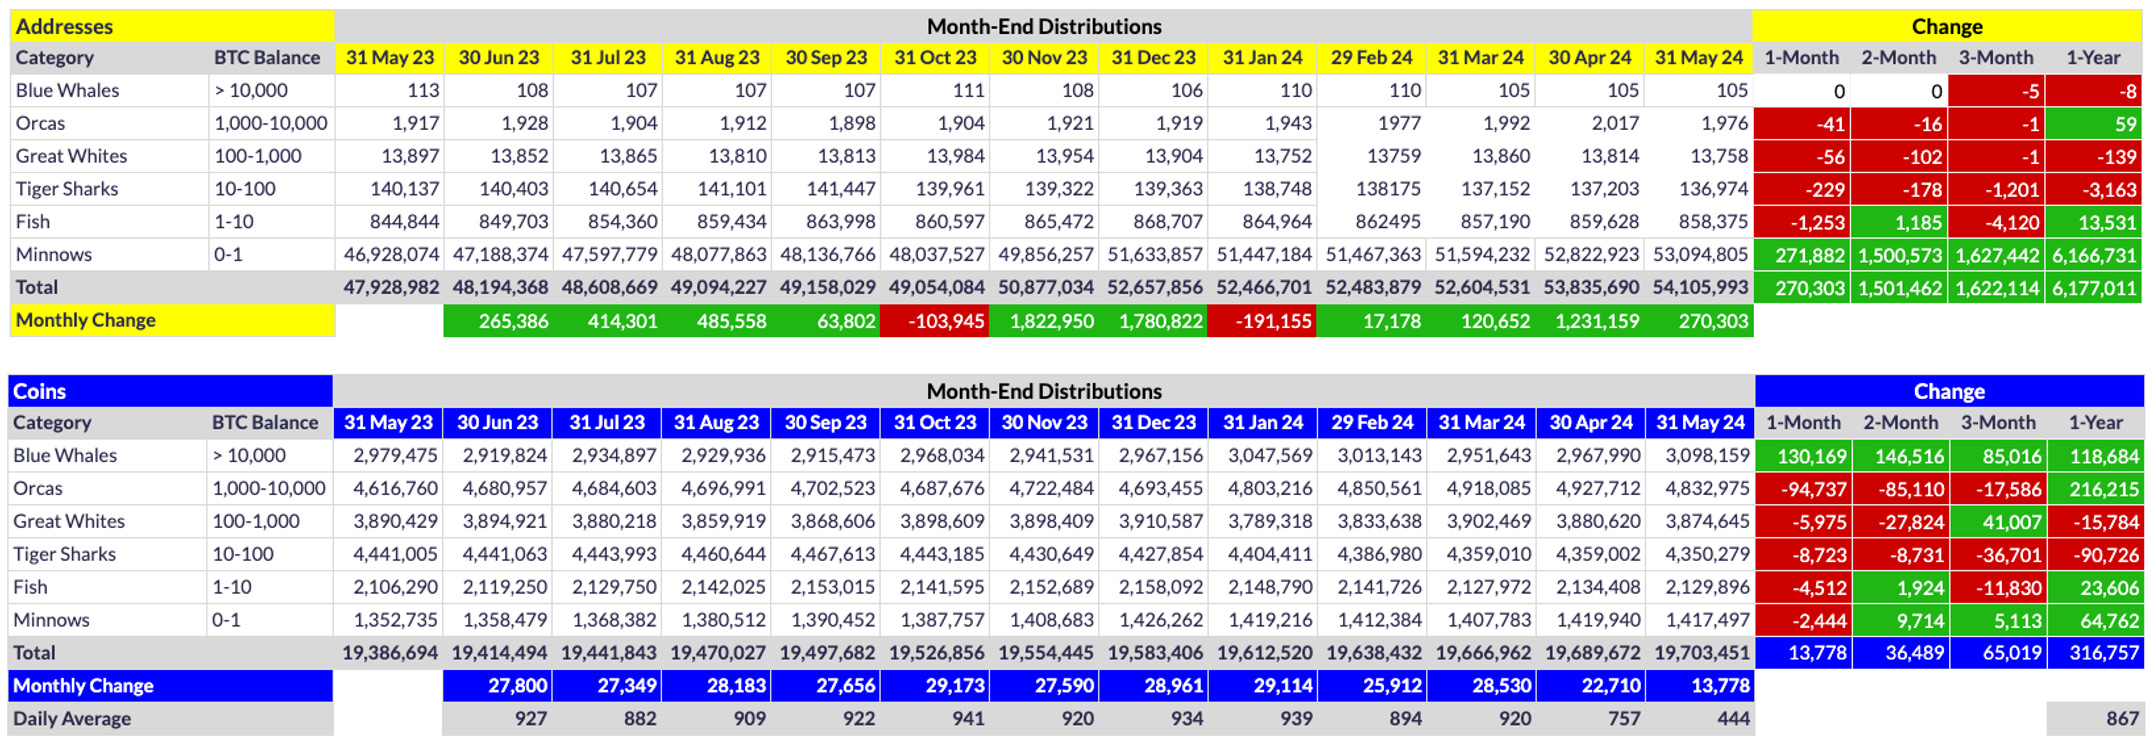
As shown above, Blue Whale (BW) addresses have remained flat two consecutive months, but that didn’t deter the pod from sucking up literally every loose coin on the market, with net gains of 130.2K coins in May and 146.5K coins the past two months. Nevertheless, Minnows continue evolving in droves, with 271.9K new Minnows in May and a whopping 1.501M new Minnows the past two months.
Interestingly, virtually all other tiers contracted the previous two months, both in terms of coins and addresses. The lone exception is modest Fish growth in April. Otherwise, Minnows and BWs are the only active market participants of late.
Below are the changes in exchange flows the past 12 months:
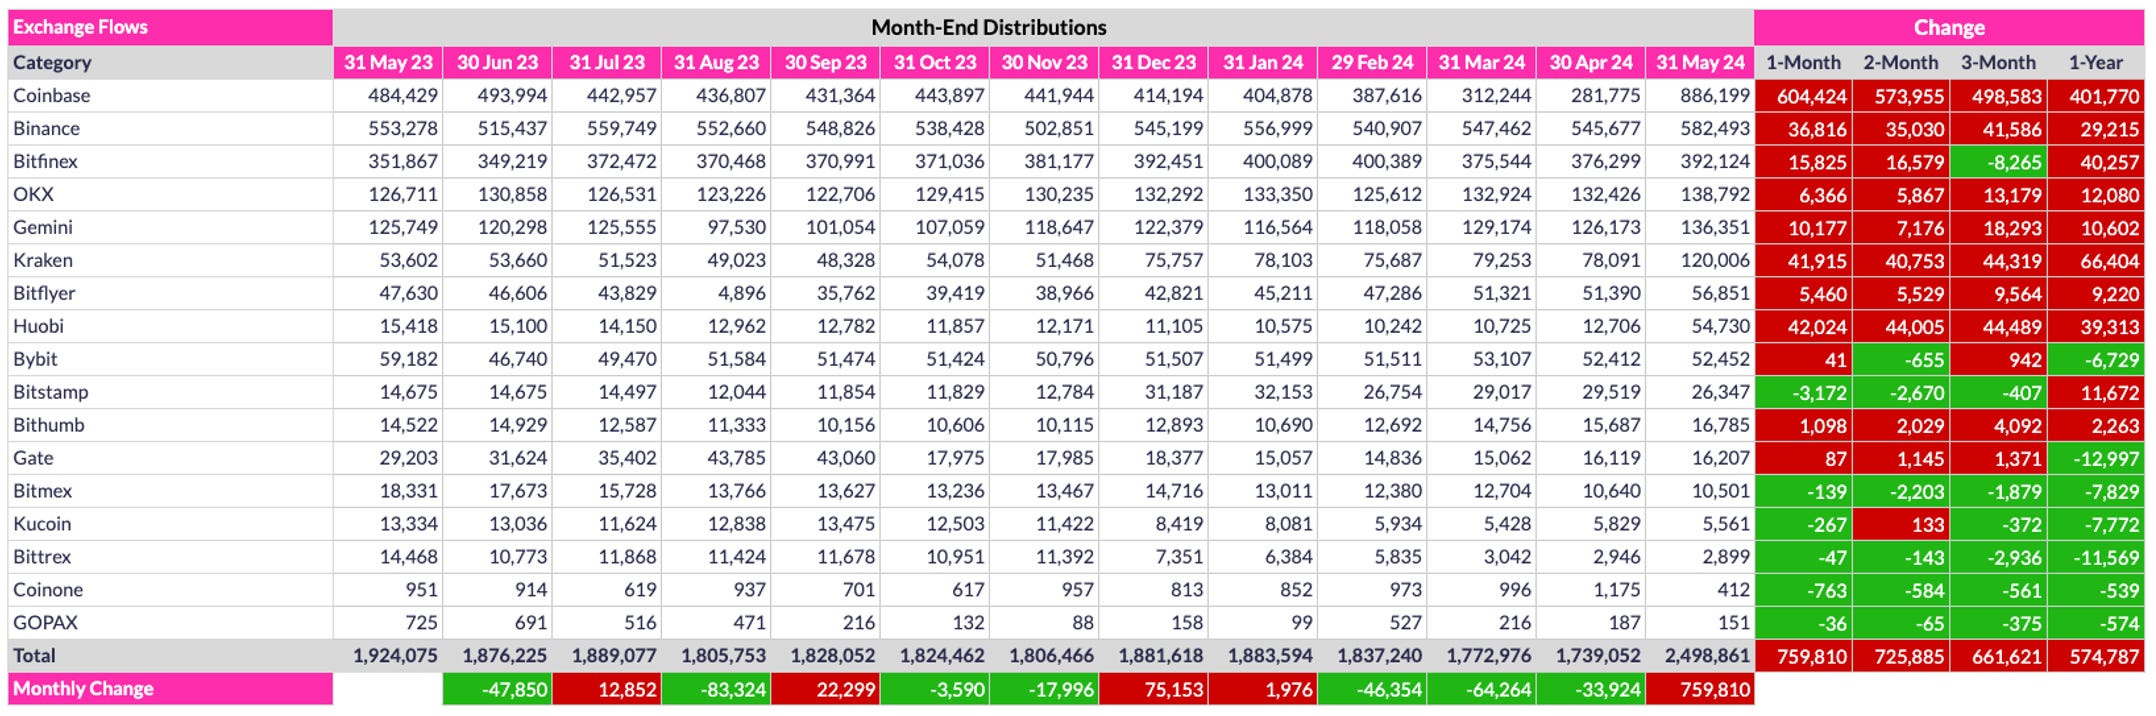
As shown above, there were substantial changes to exchange inventories in May, particularly Coinbase (604.4K coins). These changes thankfully do not represent actual exchange inflows. Instead, they reflect revisions Coinglass have made to the wallets they associate with exchanges. These revisions appeared on Coinglass’s website on May 27, so I haven’t yet had time to determine what if anything they can tell us about recent exchange flows. Prior to the revisions, exchange flows were largely flat for the month but for a sizable Coinbase outflow (16.7K coins through May 26).
While I cannot be sure, I suspect the Coinbase inventory revision reflects a decision by Coinglass to include US ETF holdings in their Coinbase exchange inventory (Coinbase is the custodian for most US ETFs). Even if so, this does not explain why other exchanges had sizable inventory revisions, including Binance (36.8K), Bitfinex (15.8K), Kraken (41.9K), and Huobi (42.0K). My guess is that Coinglass decided to perform a comprehensive wallet analysis and discovered some additional wallets they had not previously identified as exchange wallets. If/when time permits, I will try to corroborate these new Coinglass data with other inventory-exchange tracking sources (e.g., Glassnode), but in the meantime, exchange-inventory changes from next month will give us a clearer indication of where exchange inventories are headed overall.
US Exchange Traded Funds (ETFs)
As stated earlier, inflows into US ETFs are a big reason Bitcoin’s price has been sustainably bullish the past nine months (including the ETF approval front-running that occurred in Q4 2023). That said, ETF inflows have dramatically curtailed since the record-setting ETF launch.
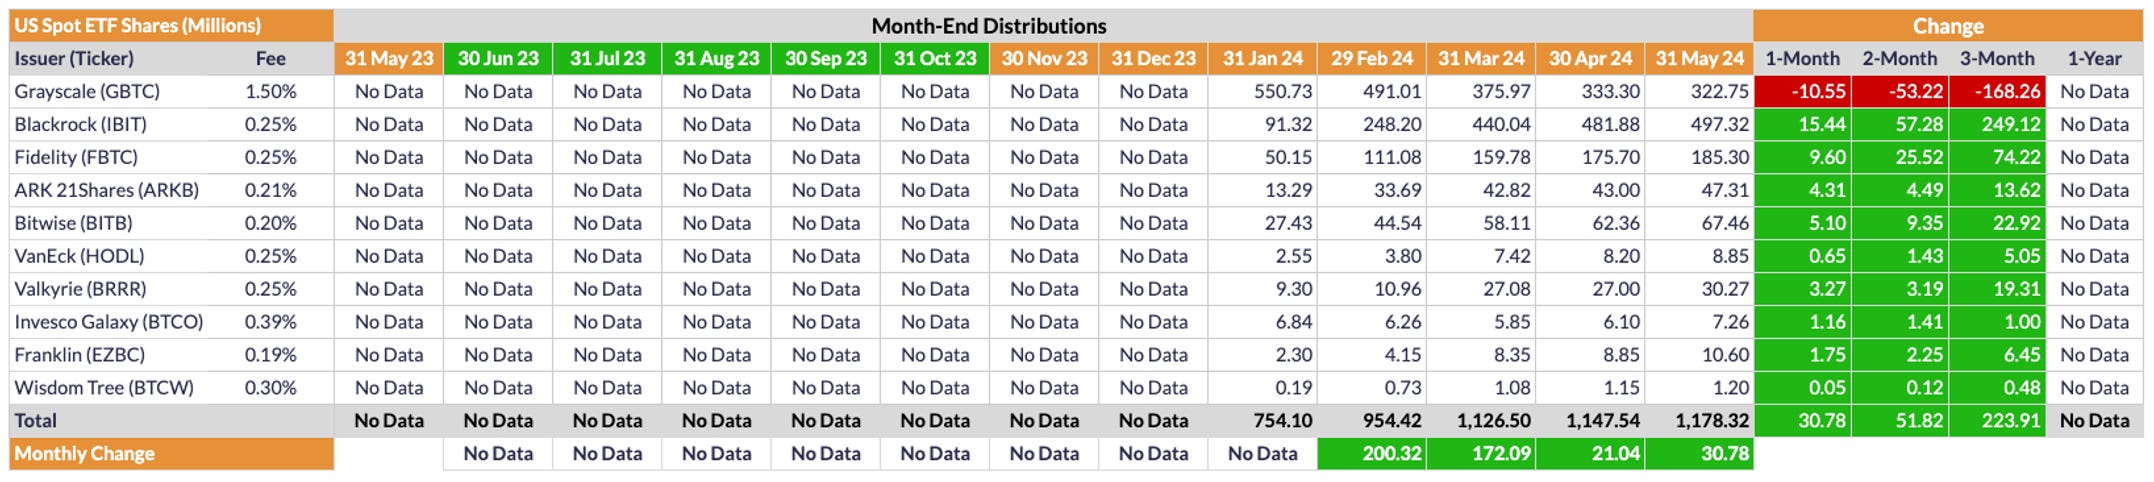
As shown above, US ETFs added 30.78M shares in May, which is a modest increase over the 21.04M shares added in April. Importantly, this growth occurred despite the near-continuous contraction of GBTC, which shed an additional 10.55M shares in May. Moreover, GBTC’s contraction in May is its smallest monthly contraction to date, and it even temporarily expanded by 680K shares between May 19 and May 21. With GBTC’s contraction seemingly nearing its end, hopefully US ETF growth overall will accelerate in the months ahead.
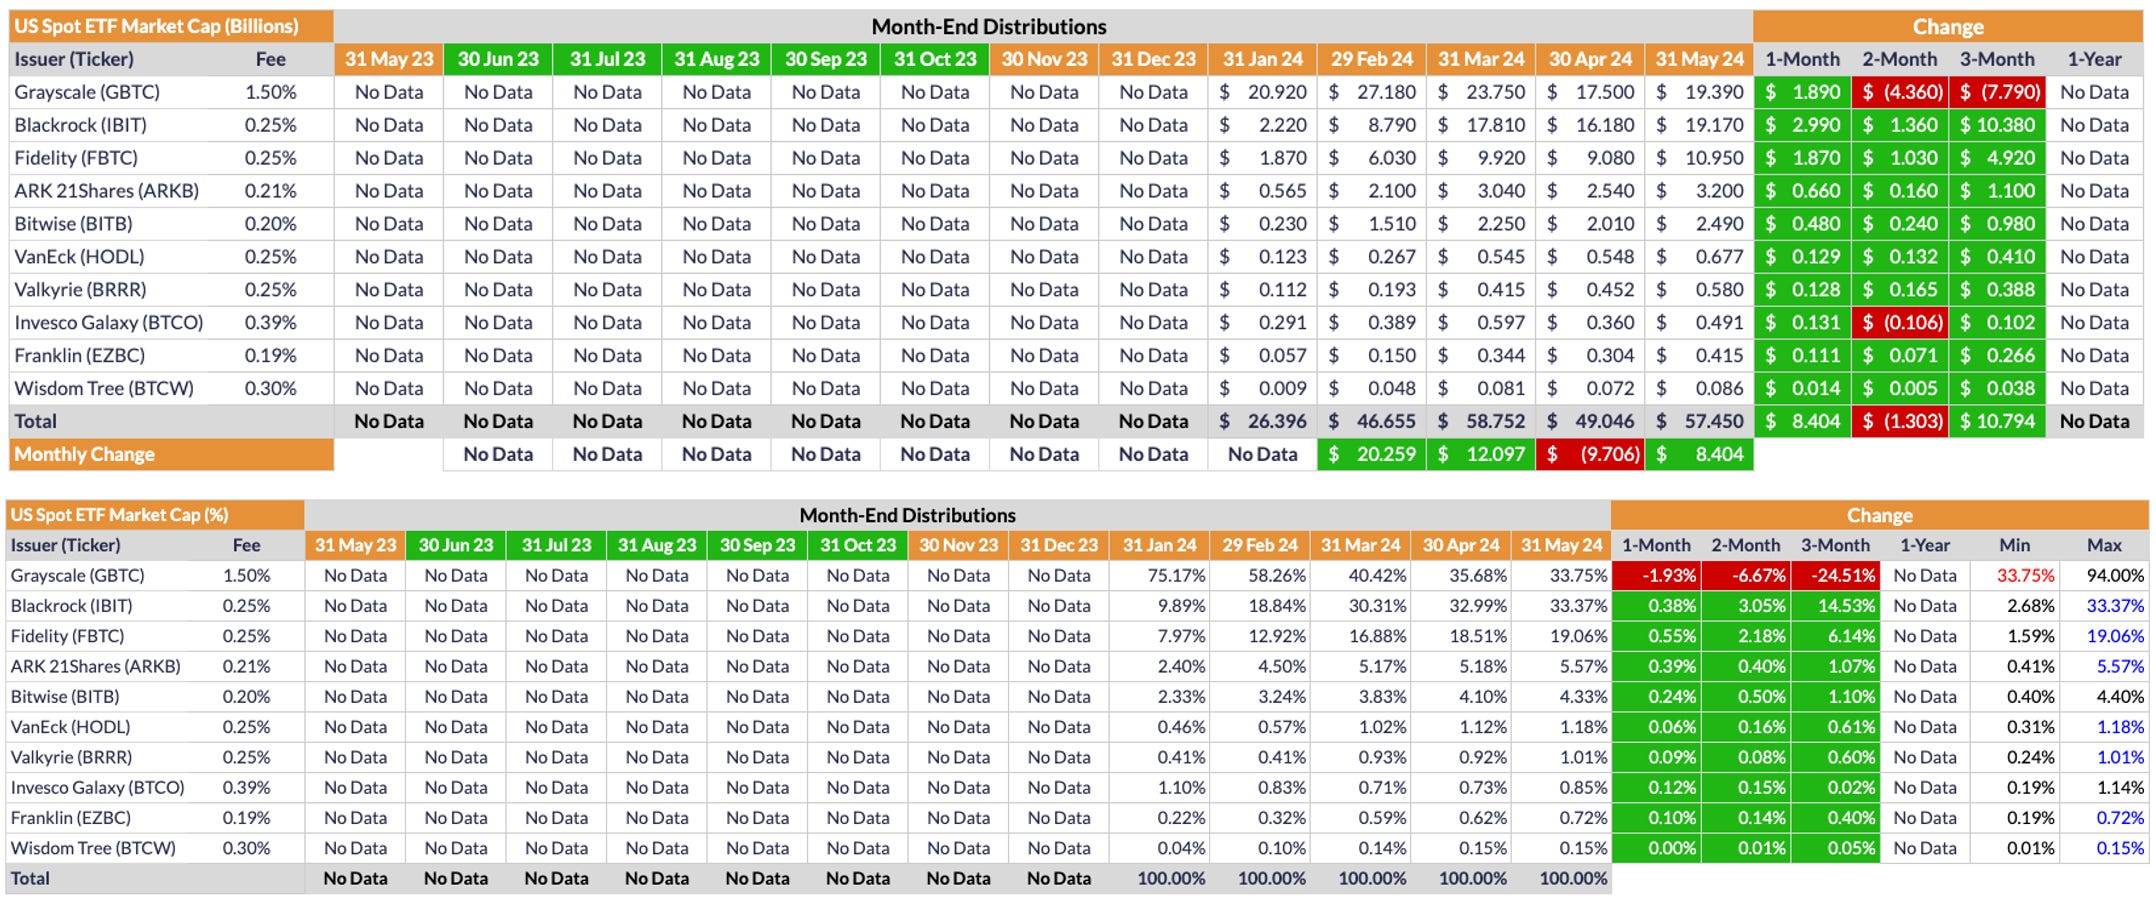
From a market-cap perspective, every ETF increased in May thanks to the 11.3% increase in Bitcoin’s price. That said, as shown above, GBTC continued contracting in terms of its share of the ETF market, losing another 1.93% in May. Conversely, every other ETF gained in market share, with several closing at their highest market share to date (indicated in blue in the far-right column of the lower chart above).
Despite its near-continuous contraction, GBTC is still the largest ETF in terms of market share, at 33.75%. However, as shown above, IBIT now has 33.37% market share, so it should pass GBTC to become the largest US ETF this coming month, provided current growth/contraction trends continue.
Conclusion
Despite the nearly continuous grind lower the final third of May, Bitcoin still managed to close the month 11.3% higher overall, which is no mean feat. It is the best May return since 2019 and nearly completely reversed the price drop that occurred in April 2024. That said, PA has been relatively weak the past three months, continually getting beat back down below $70K and on rapidly declining volume to boot. In short, there is little reason to be overly bullish right now, either from a TA or on-chain perspective. That said, there is little reason to be bearish either. i.e., With (northern hemisphere) summer on our doorstep and US institutional traders more important than ever to PA, I think we should expect a relatively quiet Q3, with price neither appreciating or depreciating much until big traders return in full force in Q4 (and in the absence of any chaos geopolitically or macroeconomically, of course). We should also begin seeing the effects of the latest supply shock kick in by Q4, which would be typical with respect to the rhythm of each Bitcoin halving cycle. In the meantime, I suggest we all embrace and enjoy the relative calm of the current market, a true rarity in Bitcoinistan.
Hope everyone is well, and of course…
Go #BTC.