Month-End Analysis
May 2022

TL;DR
Relentless selling by a subset of Orcas is the reason price swooned in May.
I do not believe price has yet found a bottom.
For the above reason, I am 55% in cash at the moment, using that money to trade on low timeframes and generate yield in stablecoins (USDC).
I will fully invest when either price reaches what I consider to be a multi-year buying opportunity or when the market turns bullish on a macro scale.
Disclaimers
1) I wrote the majority of this analysis before the faceplant during US trading hours today/yesterday (June 1). Because I do not have time to revise my analysis, please forgive the fact that a few statements, charts, etc. may seem a bit askew.
2) The on-chain data I use (BitInfoCharts, Coinglass, CoinMarketCap) to compile the tables and graphs contained in this analysis do not always align with the on-chain data found via others sources like Glassnode and CryptoQuant. I cannot explain the reason for the differences nor can I confirm which sources are most accurate. For this and other reasons, I have come to trust only the on-chain data I collect when trying to explain and/or predict Bitcoin’s (BTC) future price action (PA). Whether you too find my analysis useful is for you to decide, but I can assure you that some of my observations and/or predictions will differ, often markedly, from other observations and/or predictions you will see on Crypto Twitter (CT) and elsewhere.
Price Action
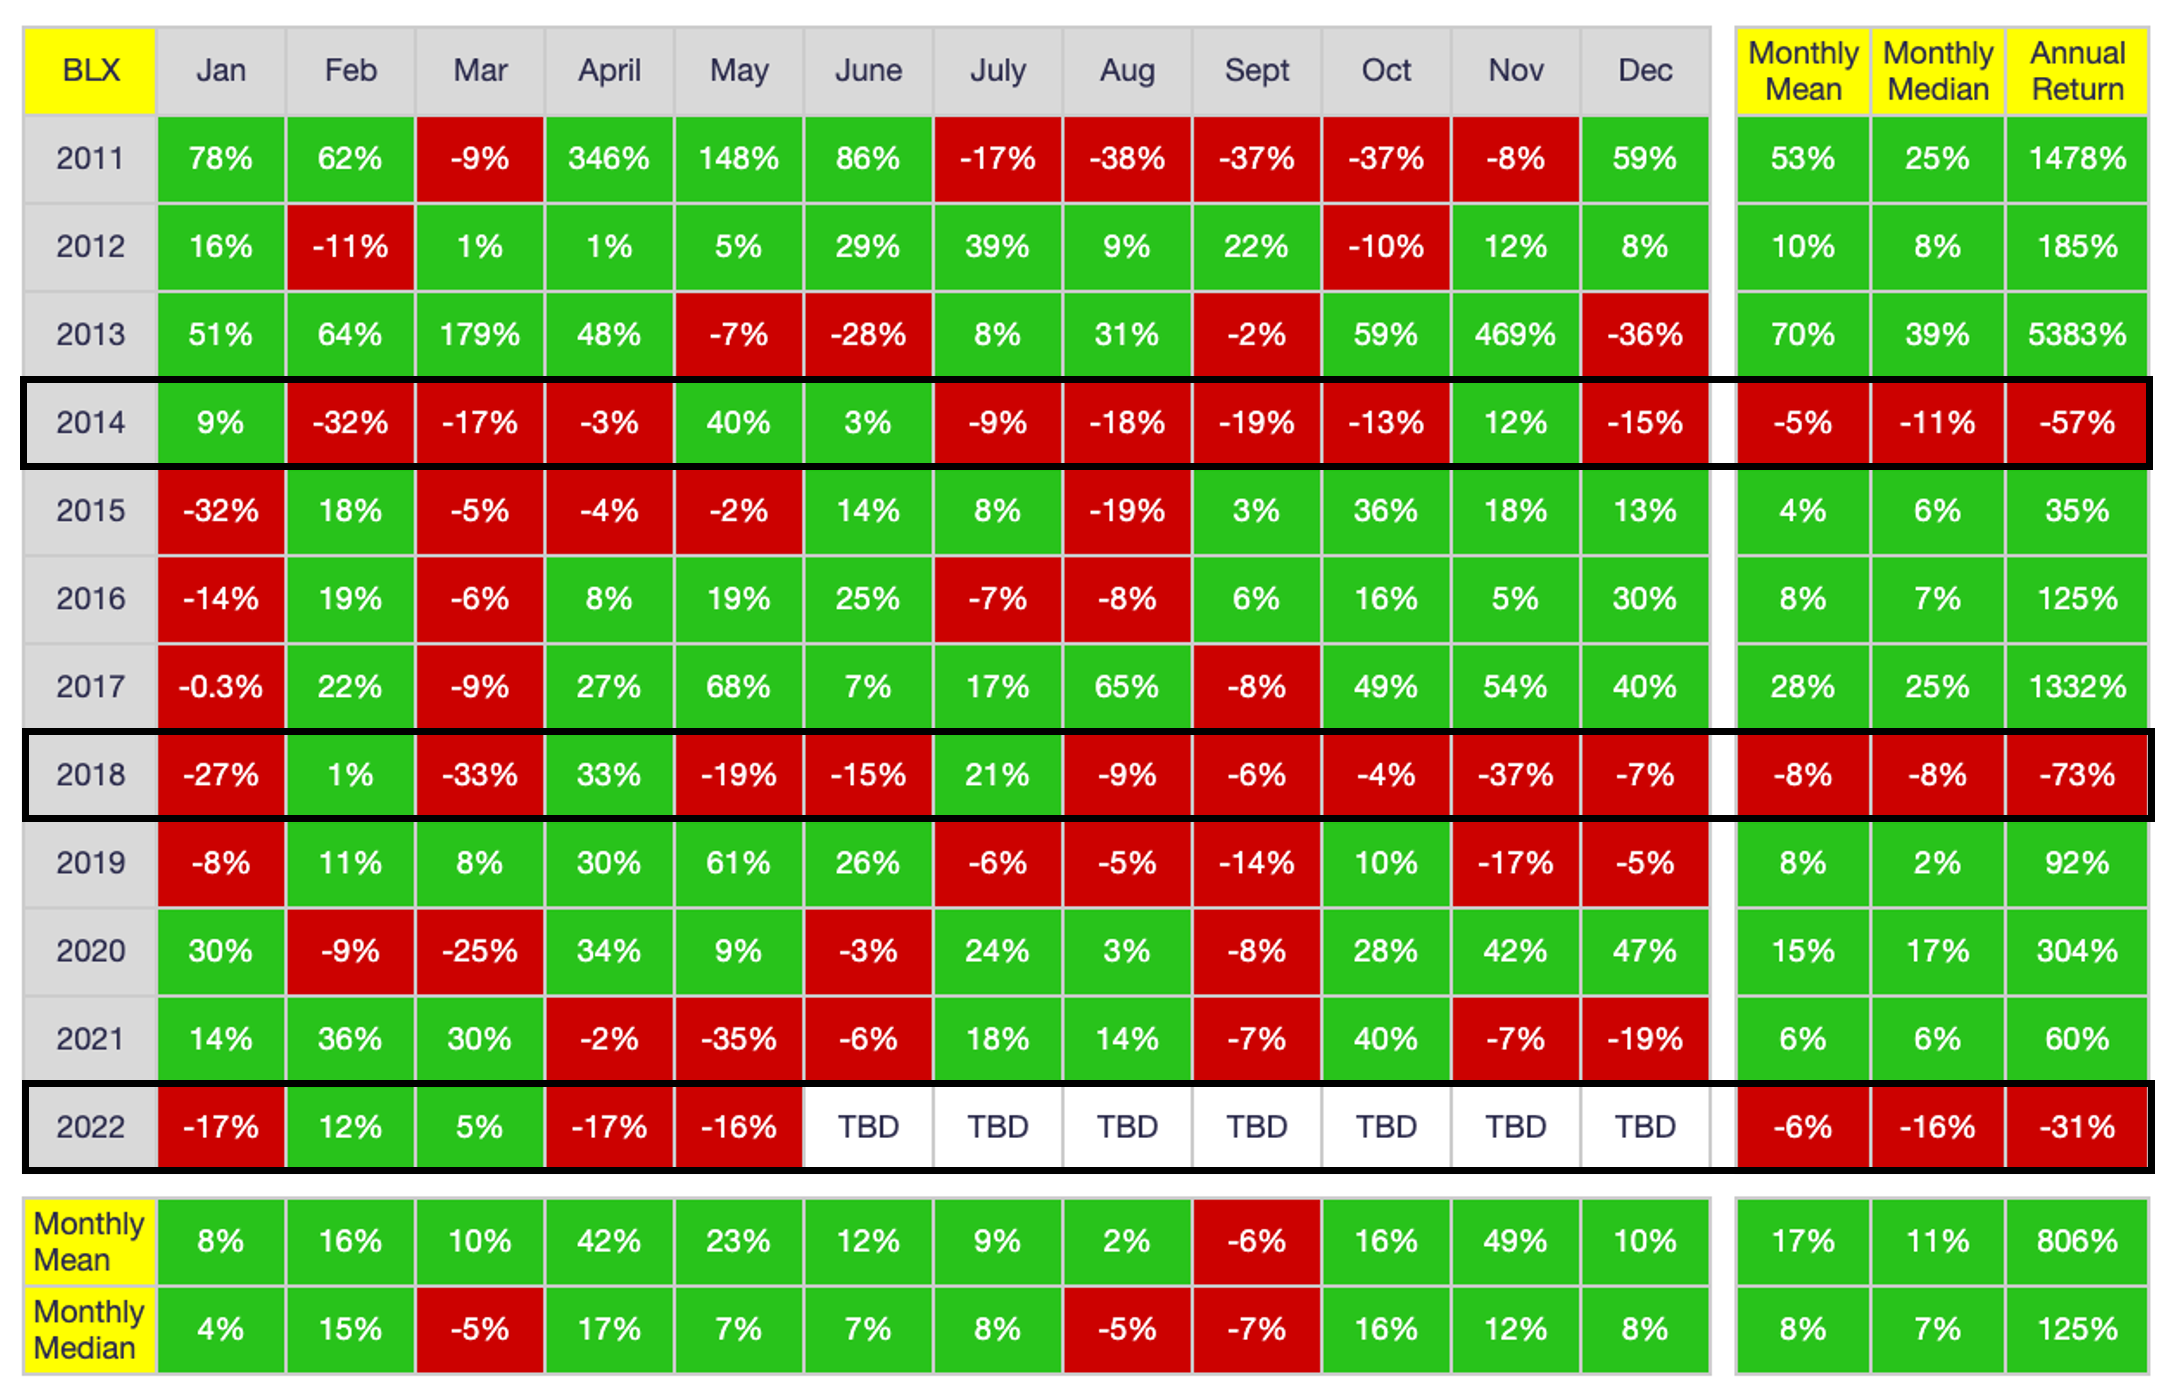
After opening the month at $37,644 (on Coinbase), BTC price peaked at a daily-close high of $39,672 four days later before spending most of the rest of the month in a free fall, reaching a daily-close low of $28,598 on May 27 before staging a modest rebound at month-end. When the dust settled, Bitcoin closed the month at $31,784, down 15.8%. As shown below, this is the third worst May performance in Bitcoin history, better only than May 2021 (-35%) and May 2018 (-19%).
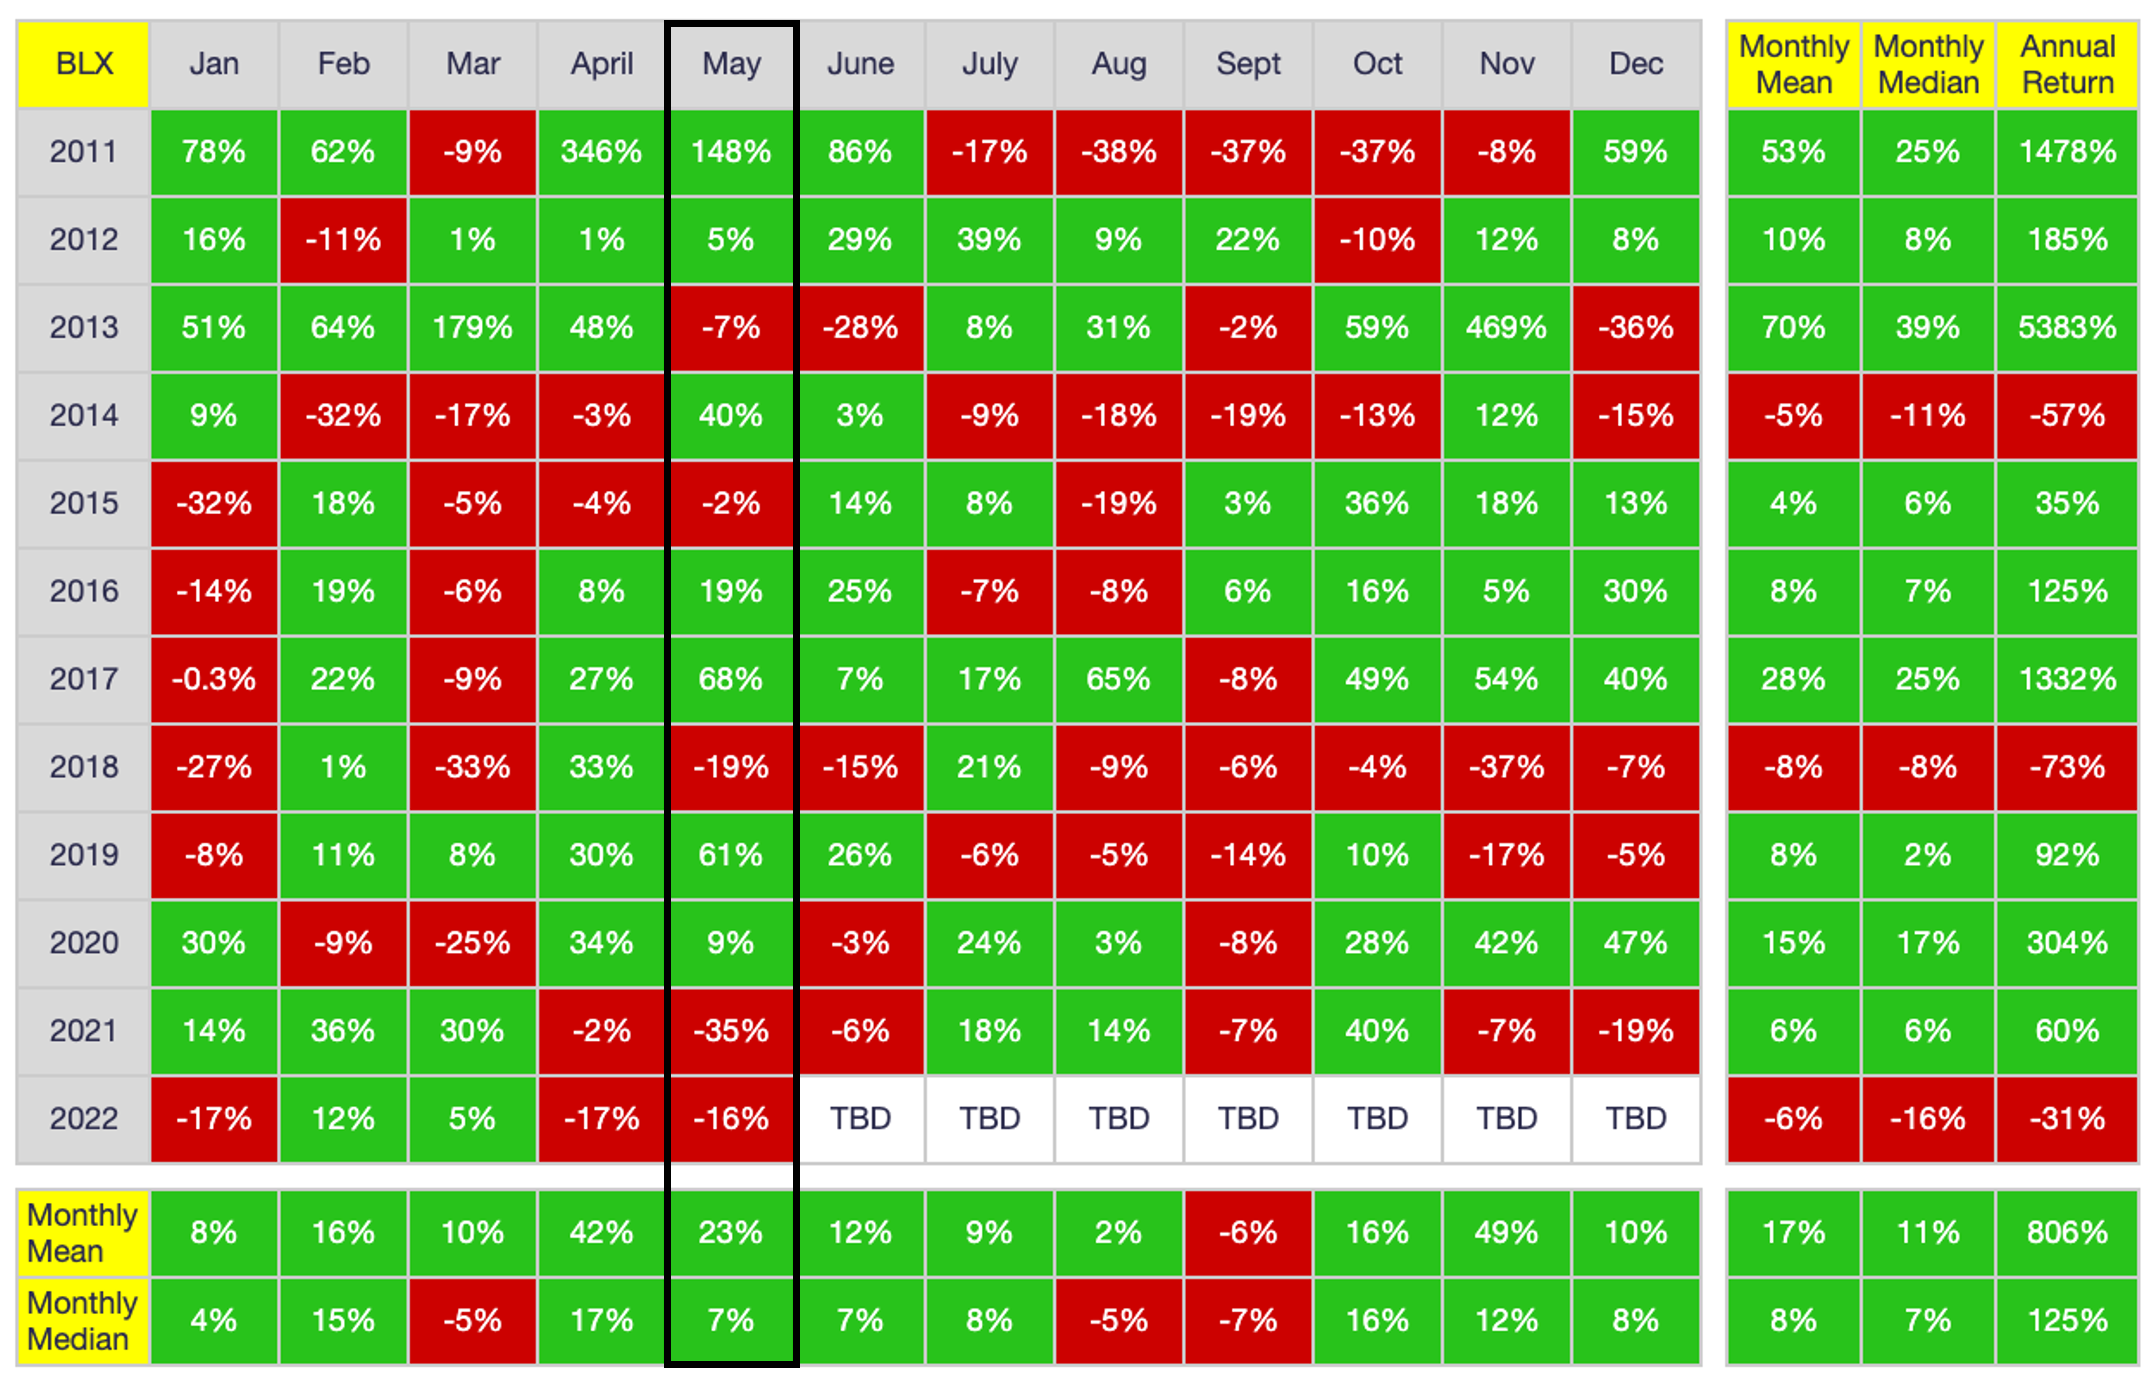
As I have explained on many occasions (and in most detail, here), I do not believe in calendar-month fractals, finding it more constructive instead to look at monthly performance based on the month’s location within the four-year halving cycle:
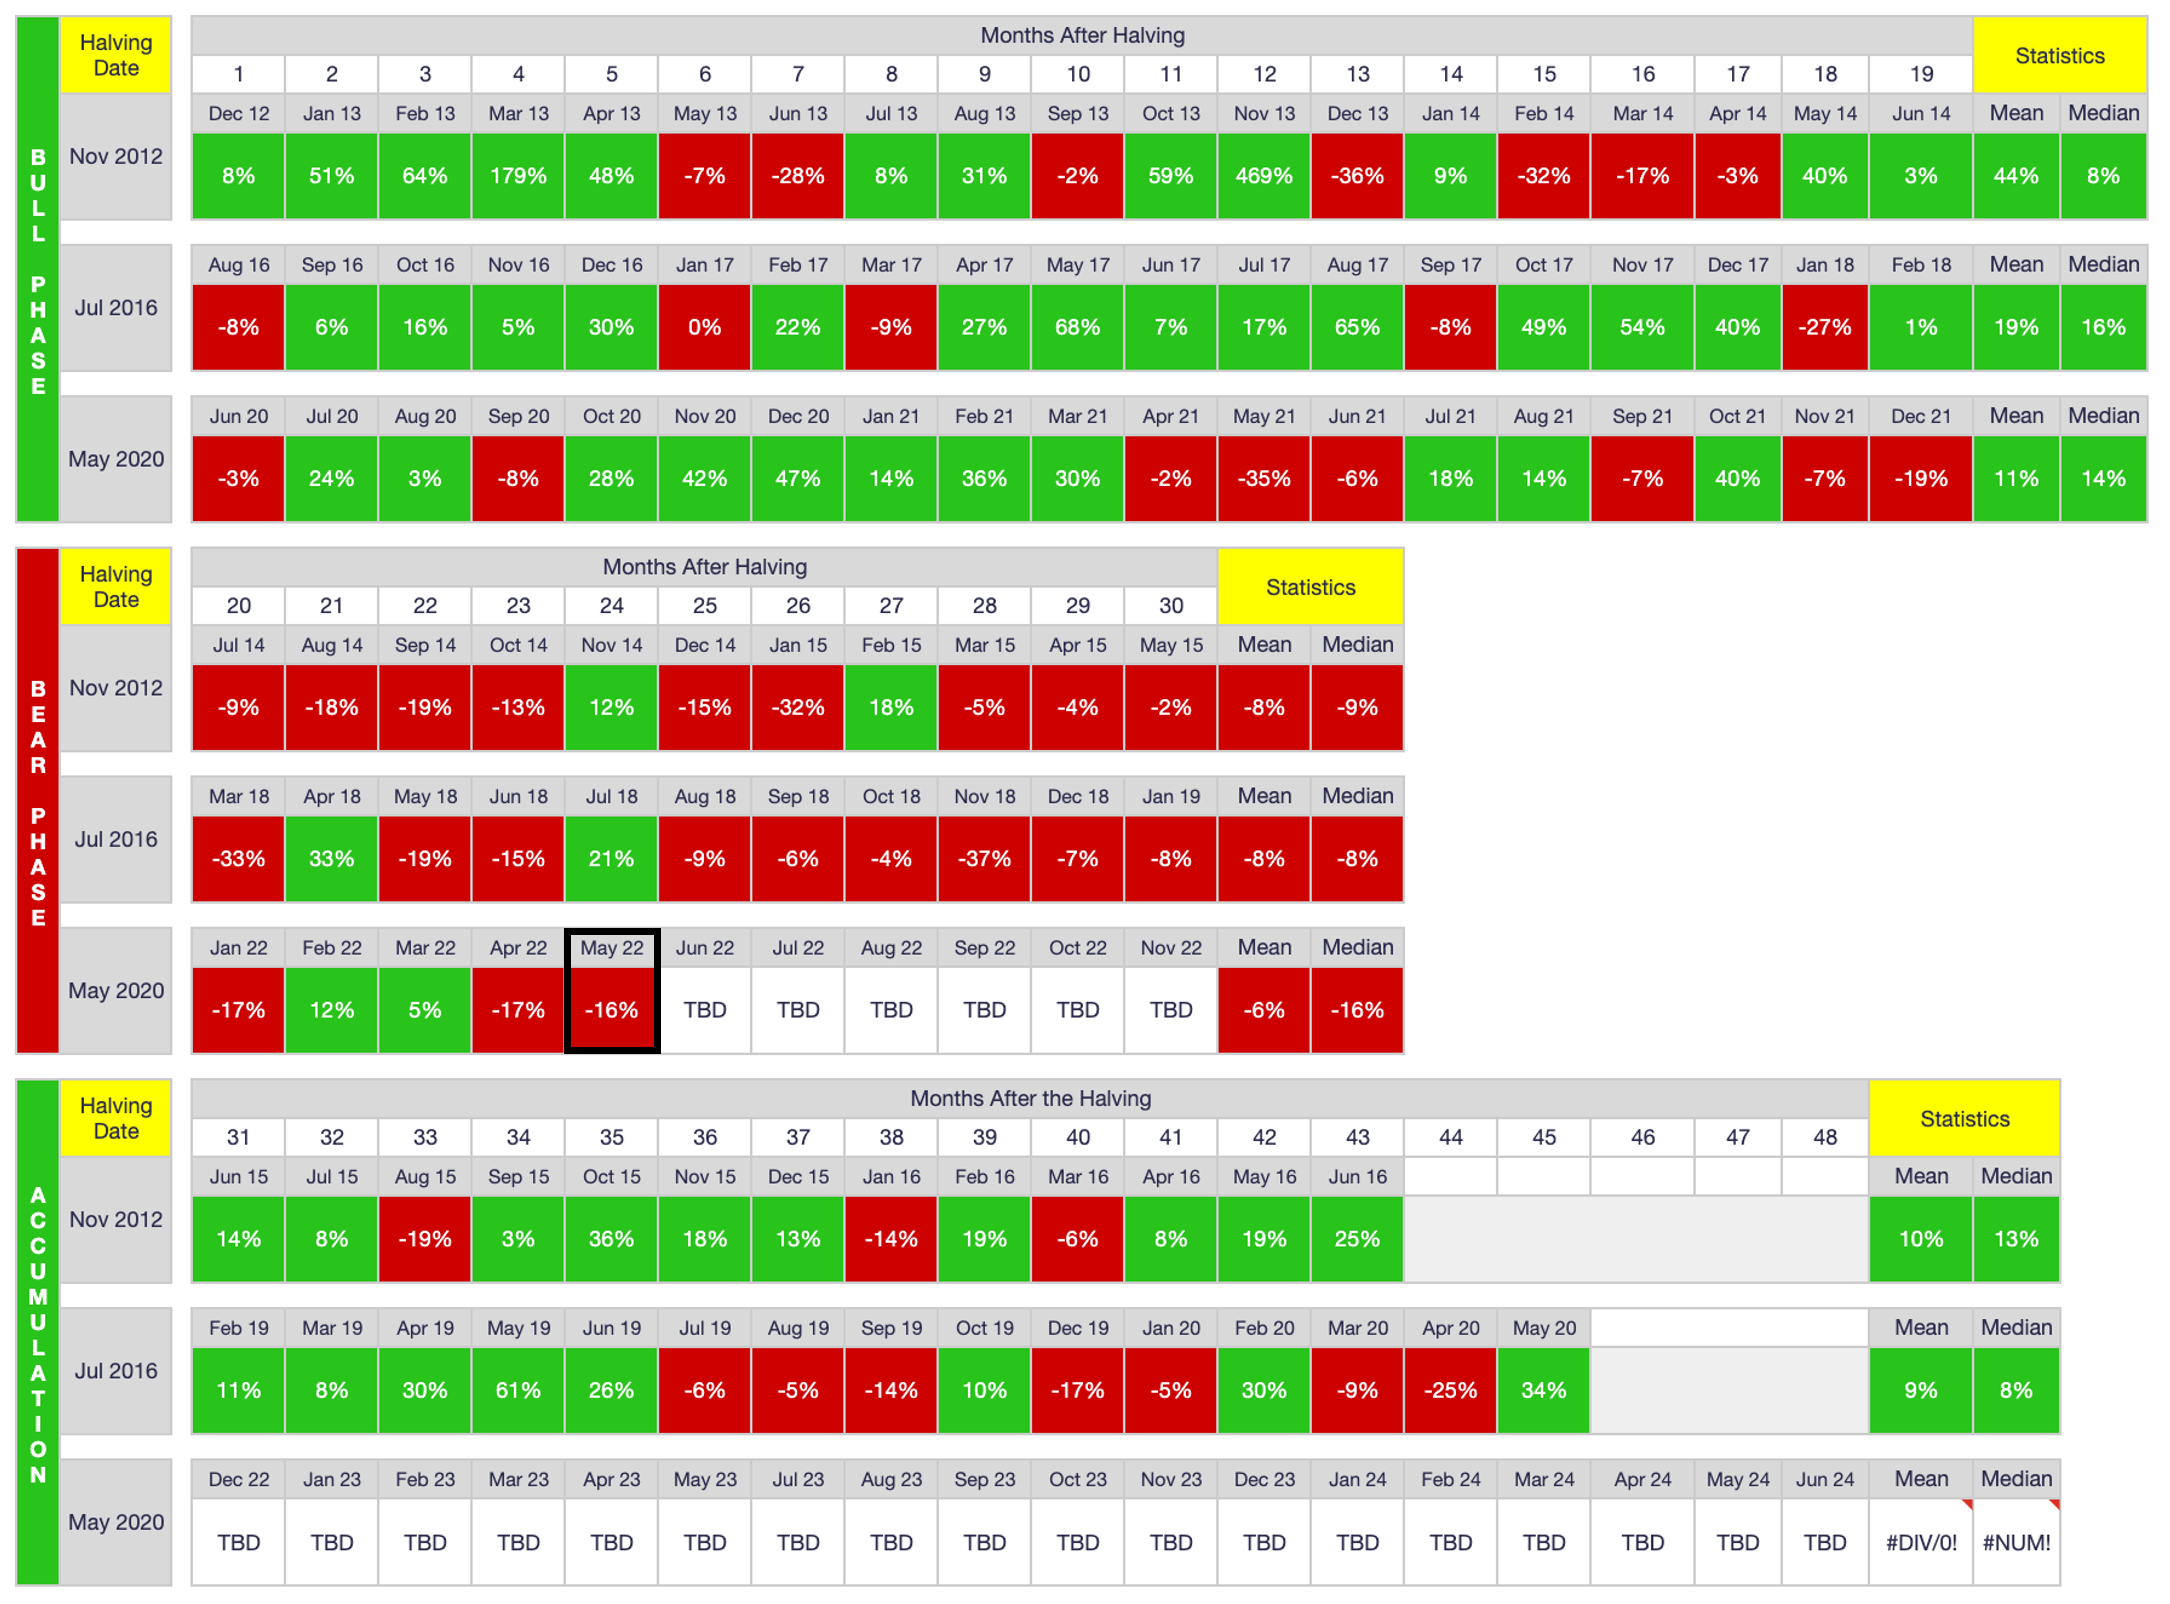
As shown above, we are now beyond the halfway point of the halving cycle, with 24 months having passed since the last halving in May 2020. Importantly, the table above illustrates that we are squarely in the middle of the bear phase of the cycle, perhaps only halfway through it in fact, scary as that prospect may be. Regardless, when viewed from a halving-cycle perspective rather than a calendar-month perspective, it is easier to see why this month was a down month despite May coincidentally being an up month in many other years over the course of Bitcoin’s short lifespan.
On-Chain Data Analysis
Below are the address counts for the past 12 months. As shown, there are reasons to be both bullish and bearish in terms of network activity. First and foremost, retail investors continue joining the network in droves, with steady increases among the Fish and Minnows in all but two of the past 12 months, and with another new all-time high (ATH) this month (at more than 42.2M active network addresses). Such near-continuous address growth provides clear evidence that Bitcoin is here to stay, just like all successful diffusions of innovation that have preceded it.
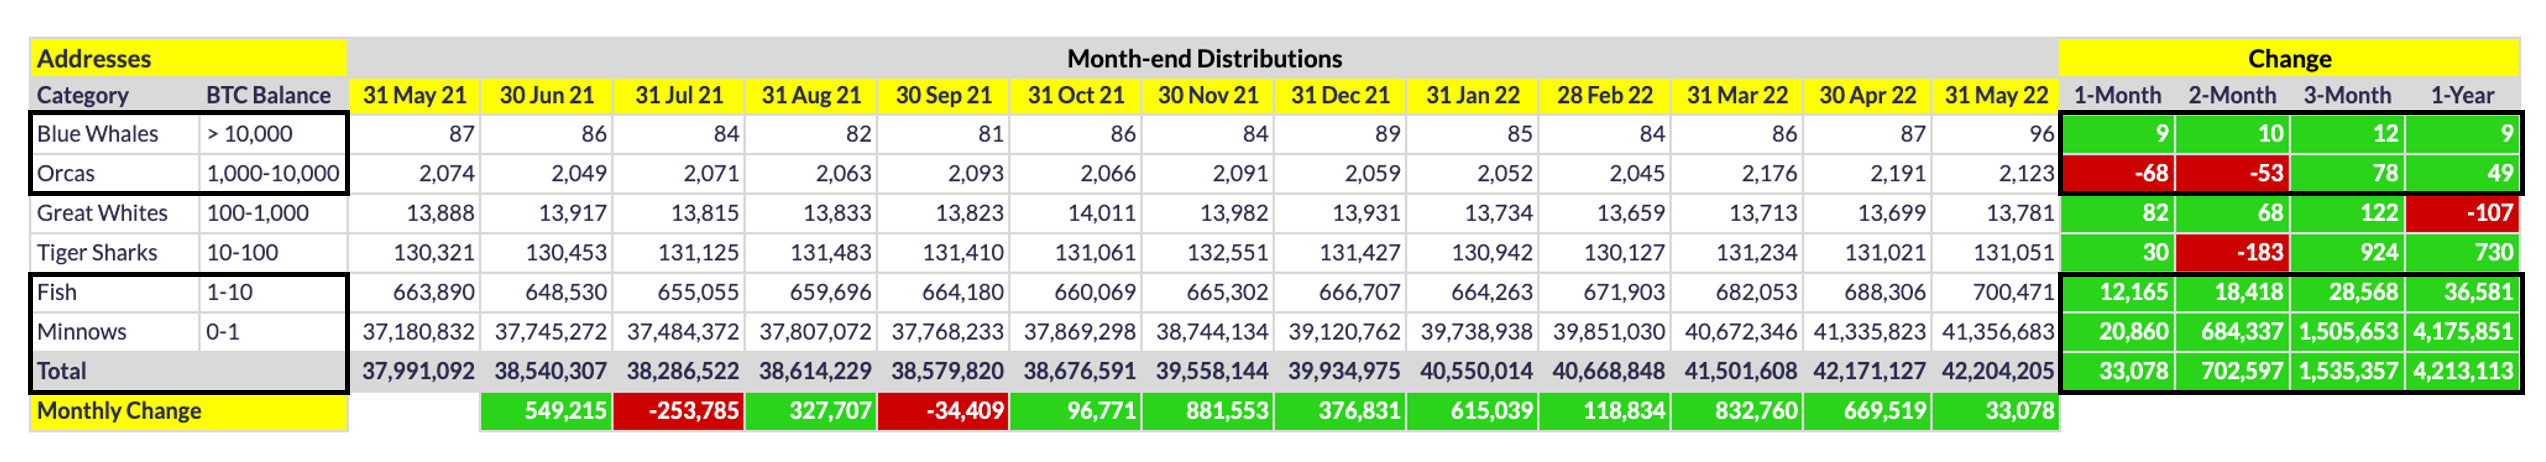
That said, network adoption by its most influential participants - the whales - has not been universally bullish. As shown above, Blue Whales (BWs) have been increasing steadily, and particularly so over the past three months, with 12 new BWs joining the network since early March. This is very encouraging because most BWs exhibit hodling behavior, which helps solidify the floor undergirding Bitcoin’s price.
On the other hand, Orcas have been devolving at an alarming rate recently, which I would argue explains the reason price has collapsed over the past two months. Their numbers have in fact stabilized the past few days, which I would argue is the reason price has been able to rebound the past few days. Whether the current rebound lasts is another matter. It all depends on whether the recent influx of Orcas sustains. Either way, I continue to believe that Orca-count trends remain the single most important factor when trying to infer future PA (I make my case here and here for those who have yet to come across these articles).
Visual evidence of how Orca-count trends have influenced recent PA is below:
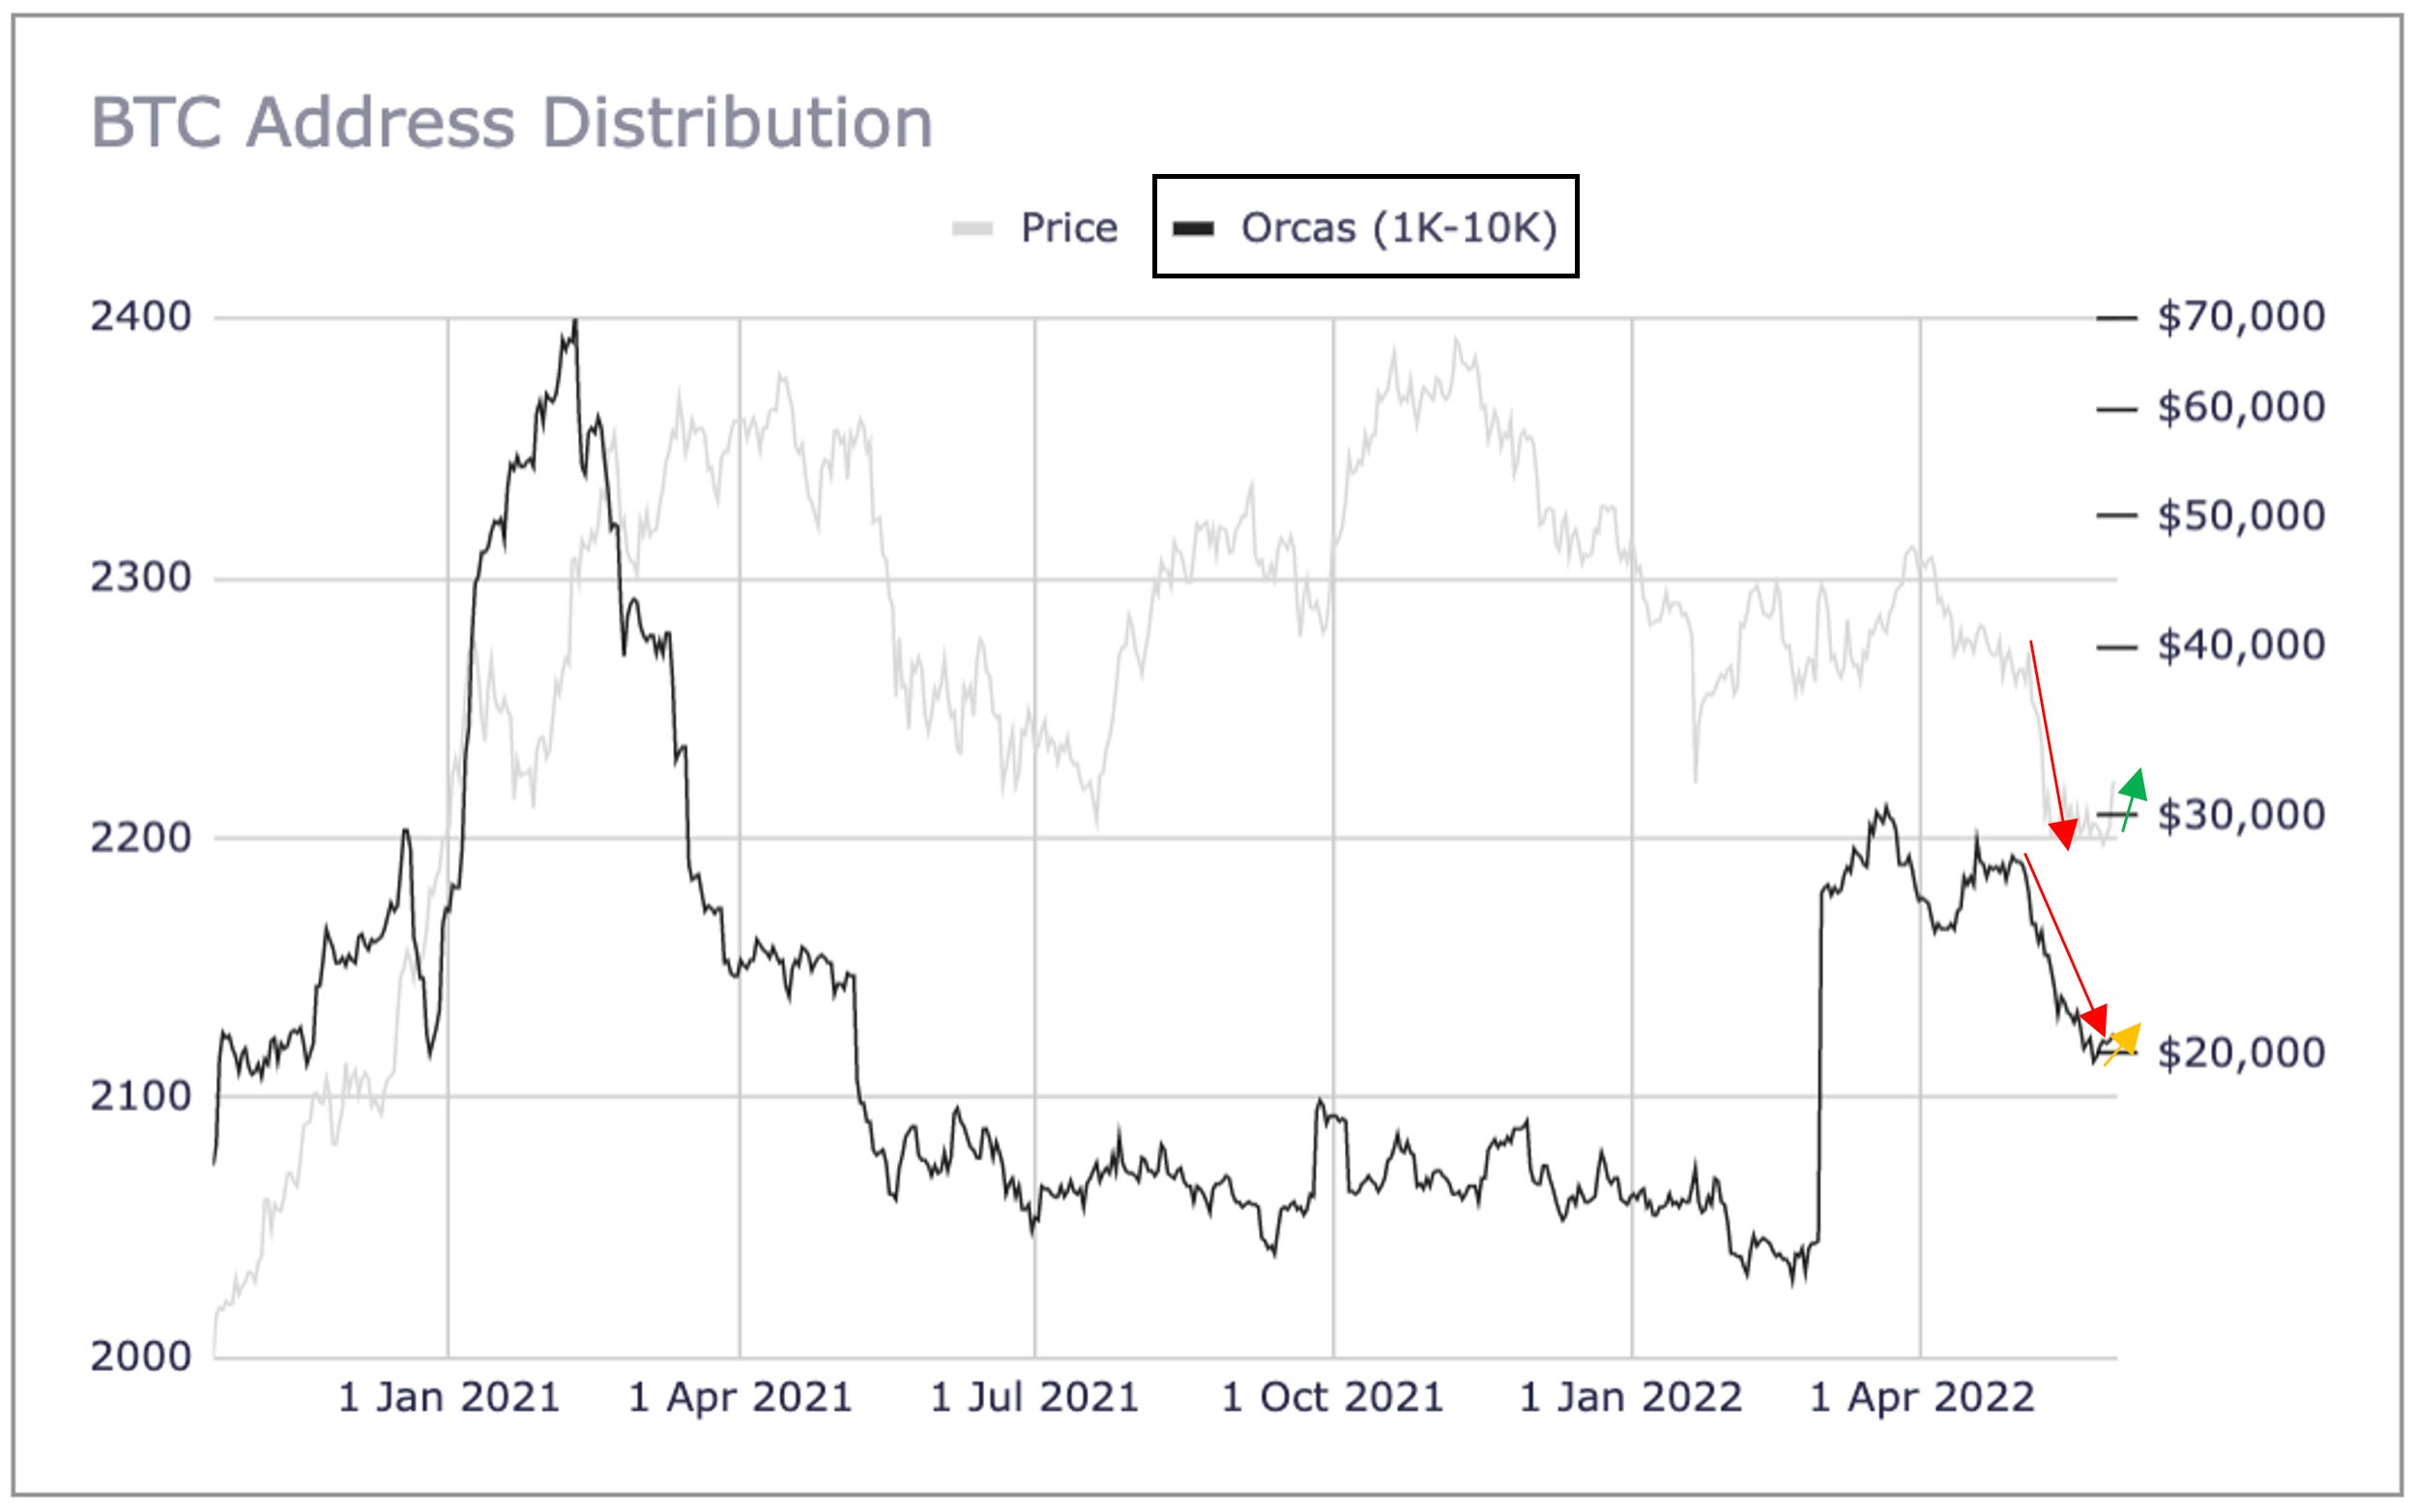
Note that the decline in Orca counts preceded the latest drop in price, just as it always does. This Orca contraction can be seen via the coin distribution data as well:
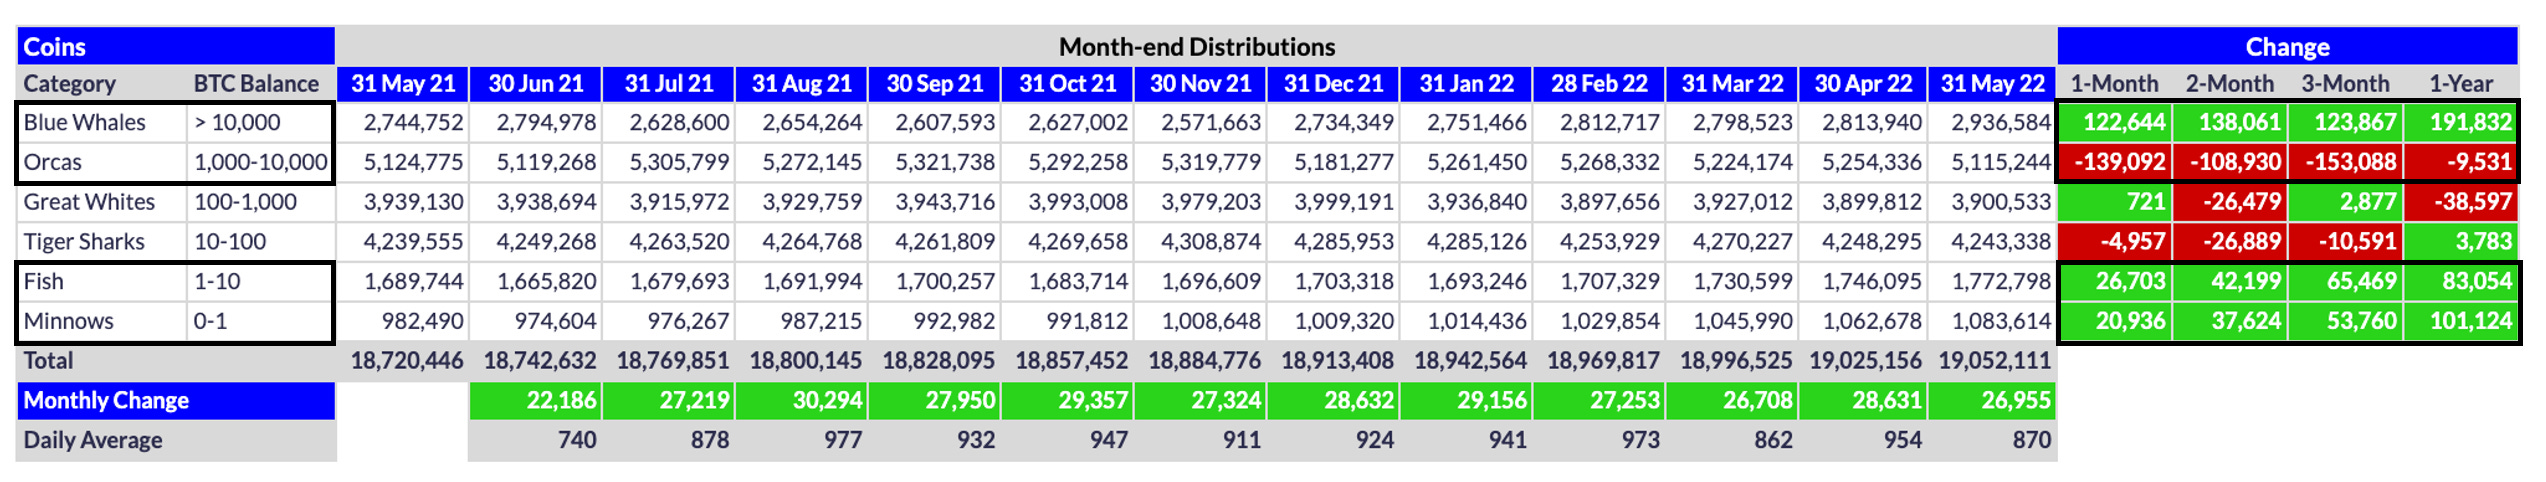
As shown above, Blue Whales have mercifully swallowed nearly all of the coins that Orcas have vomited over the past 90 days, with retail buyers (Fish and Minnows) devouring the rest. While such accumulation helps provide price-floor support, it unfortunately does little to induce a substantial and/or sustainable price rally. In other words, until Orca counts start steadily climbing again, like they did in late 2020, any subsequent price increases will be insubstantial and/or unsustainable.
Another unfortunate trend that emerged during May is a significant inflow of coins into exchanges. Unfortunately, the data I collect were aberrant/unavailable for several months, so the steady exchange outflow that occurred over the past year is not visible in the table below. However, what is visible is the complete reversal of fortune that occurred during May when compared to April.
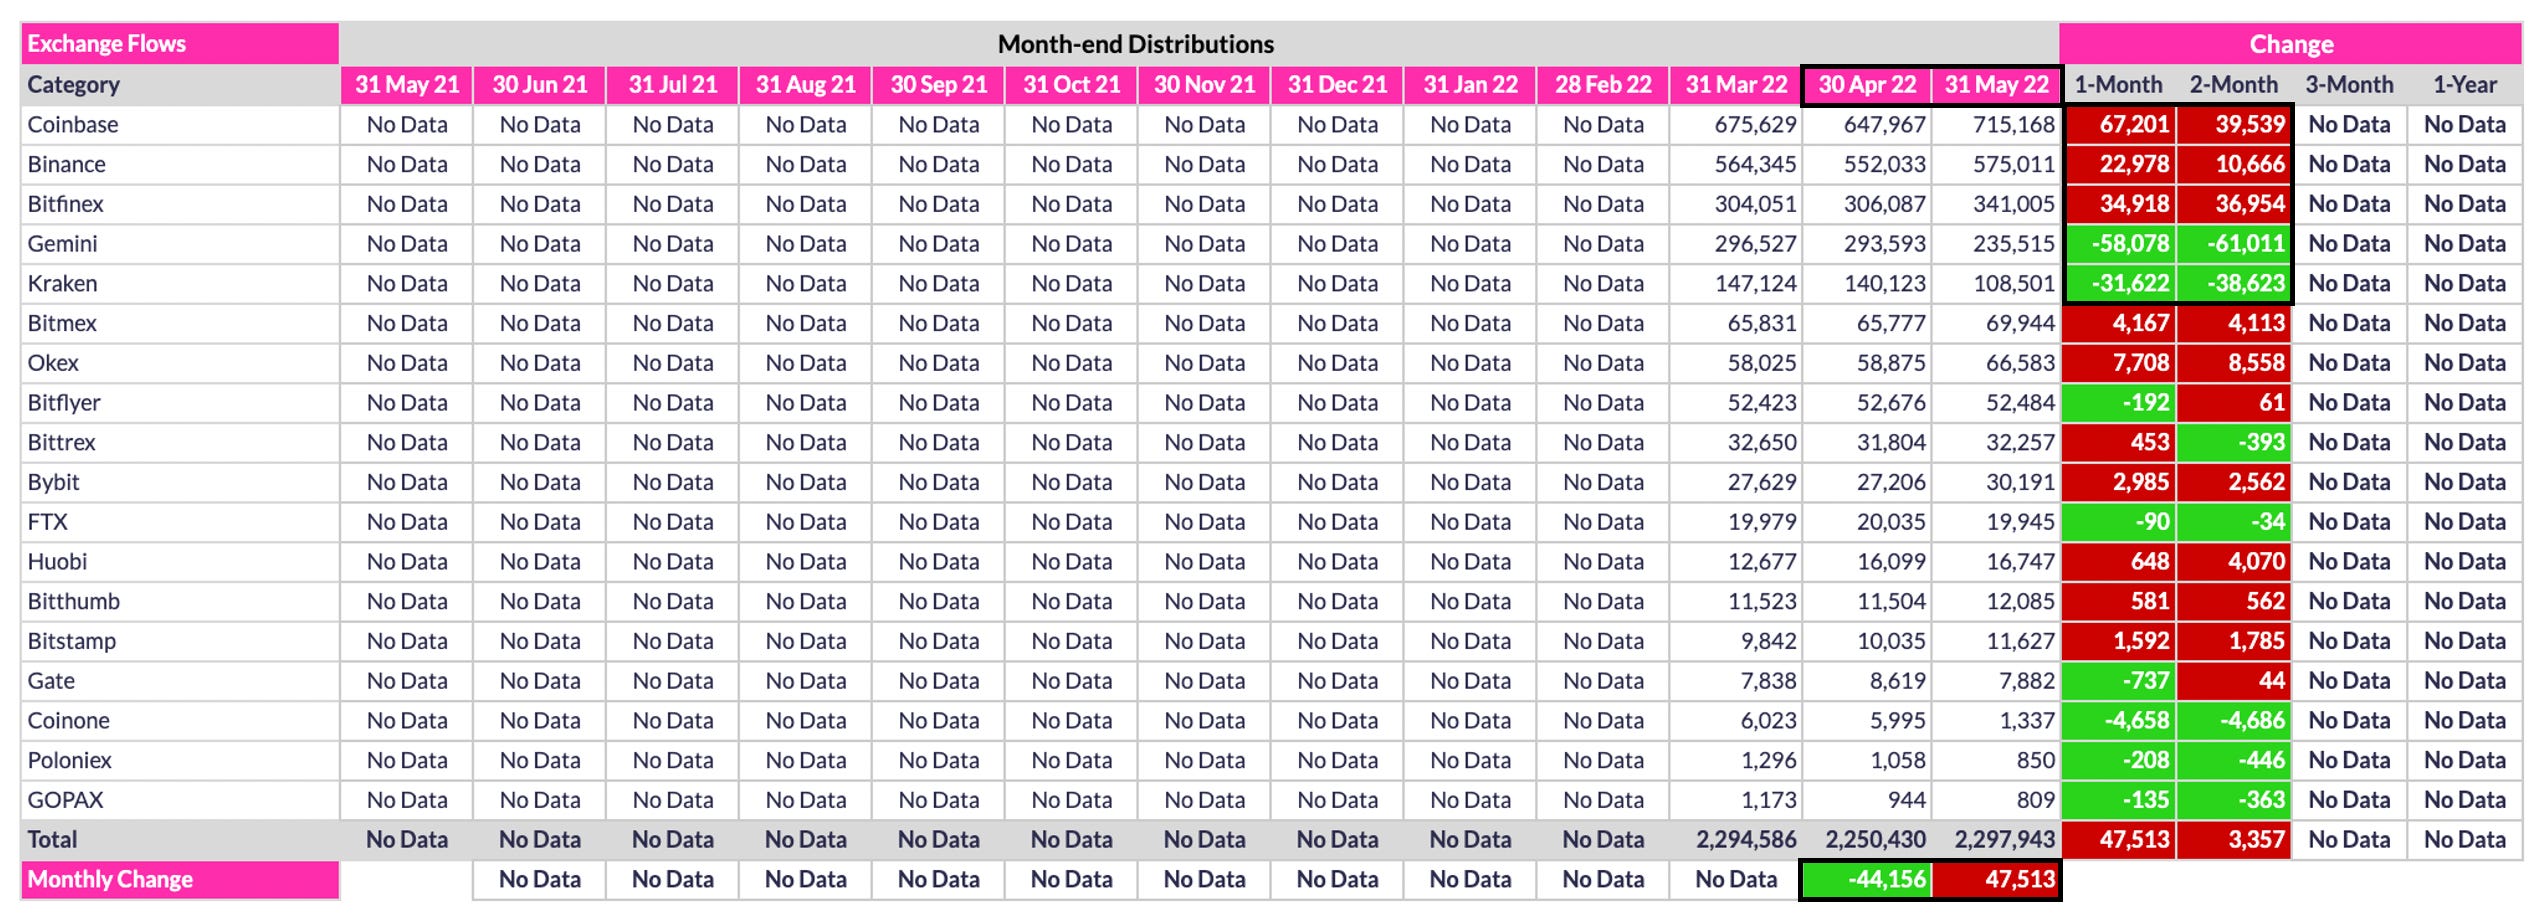
As shown above, 44.2K coins outflowed from the listed exchanges in April, but 47.5K coins inflowed in May. The vast majority of these inflows were from a handful of Orcas, but regardless of the source, this inflow has hindered the eventual supply shock that new investors will oneday confront when exchange inventories evaporate once and for all.
In sum, on-chain data were mixed in May, with big address and coin gains for the Blue Whales and retail investors but significant losses among the Orcas. The net effect was strong downward price pressure throughout the month, due mostly to the relentless selling by a handful of unruly Orcas.
The Bigger Picture
Zooming out a bit, the weekly price chart below shows just how prolonged the current swoon has been:
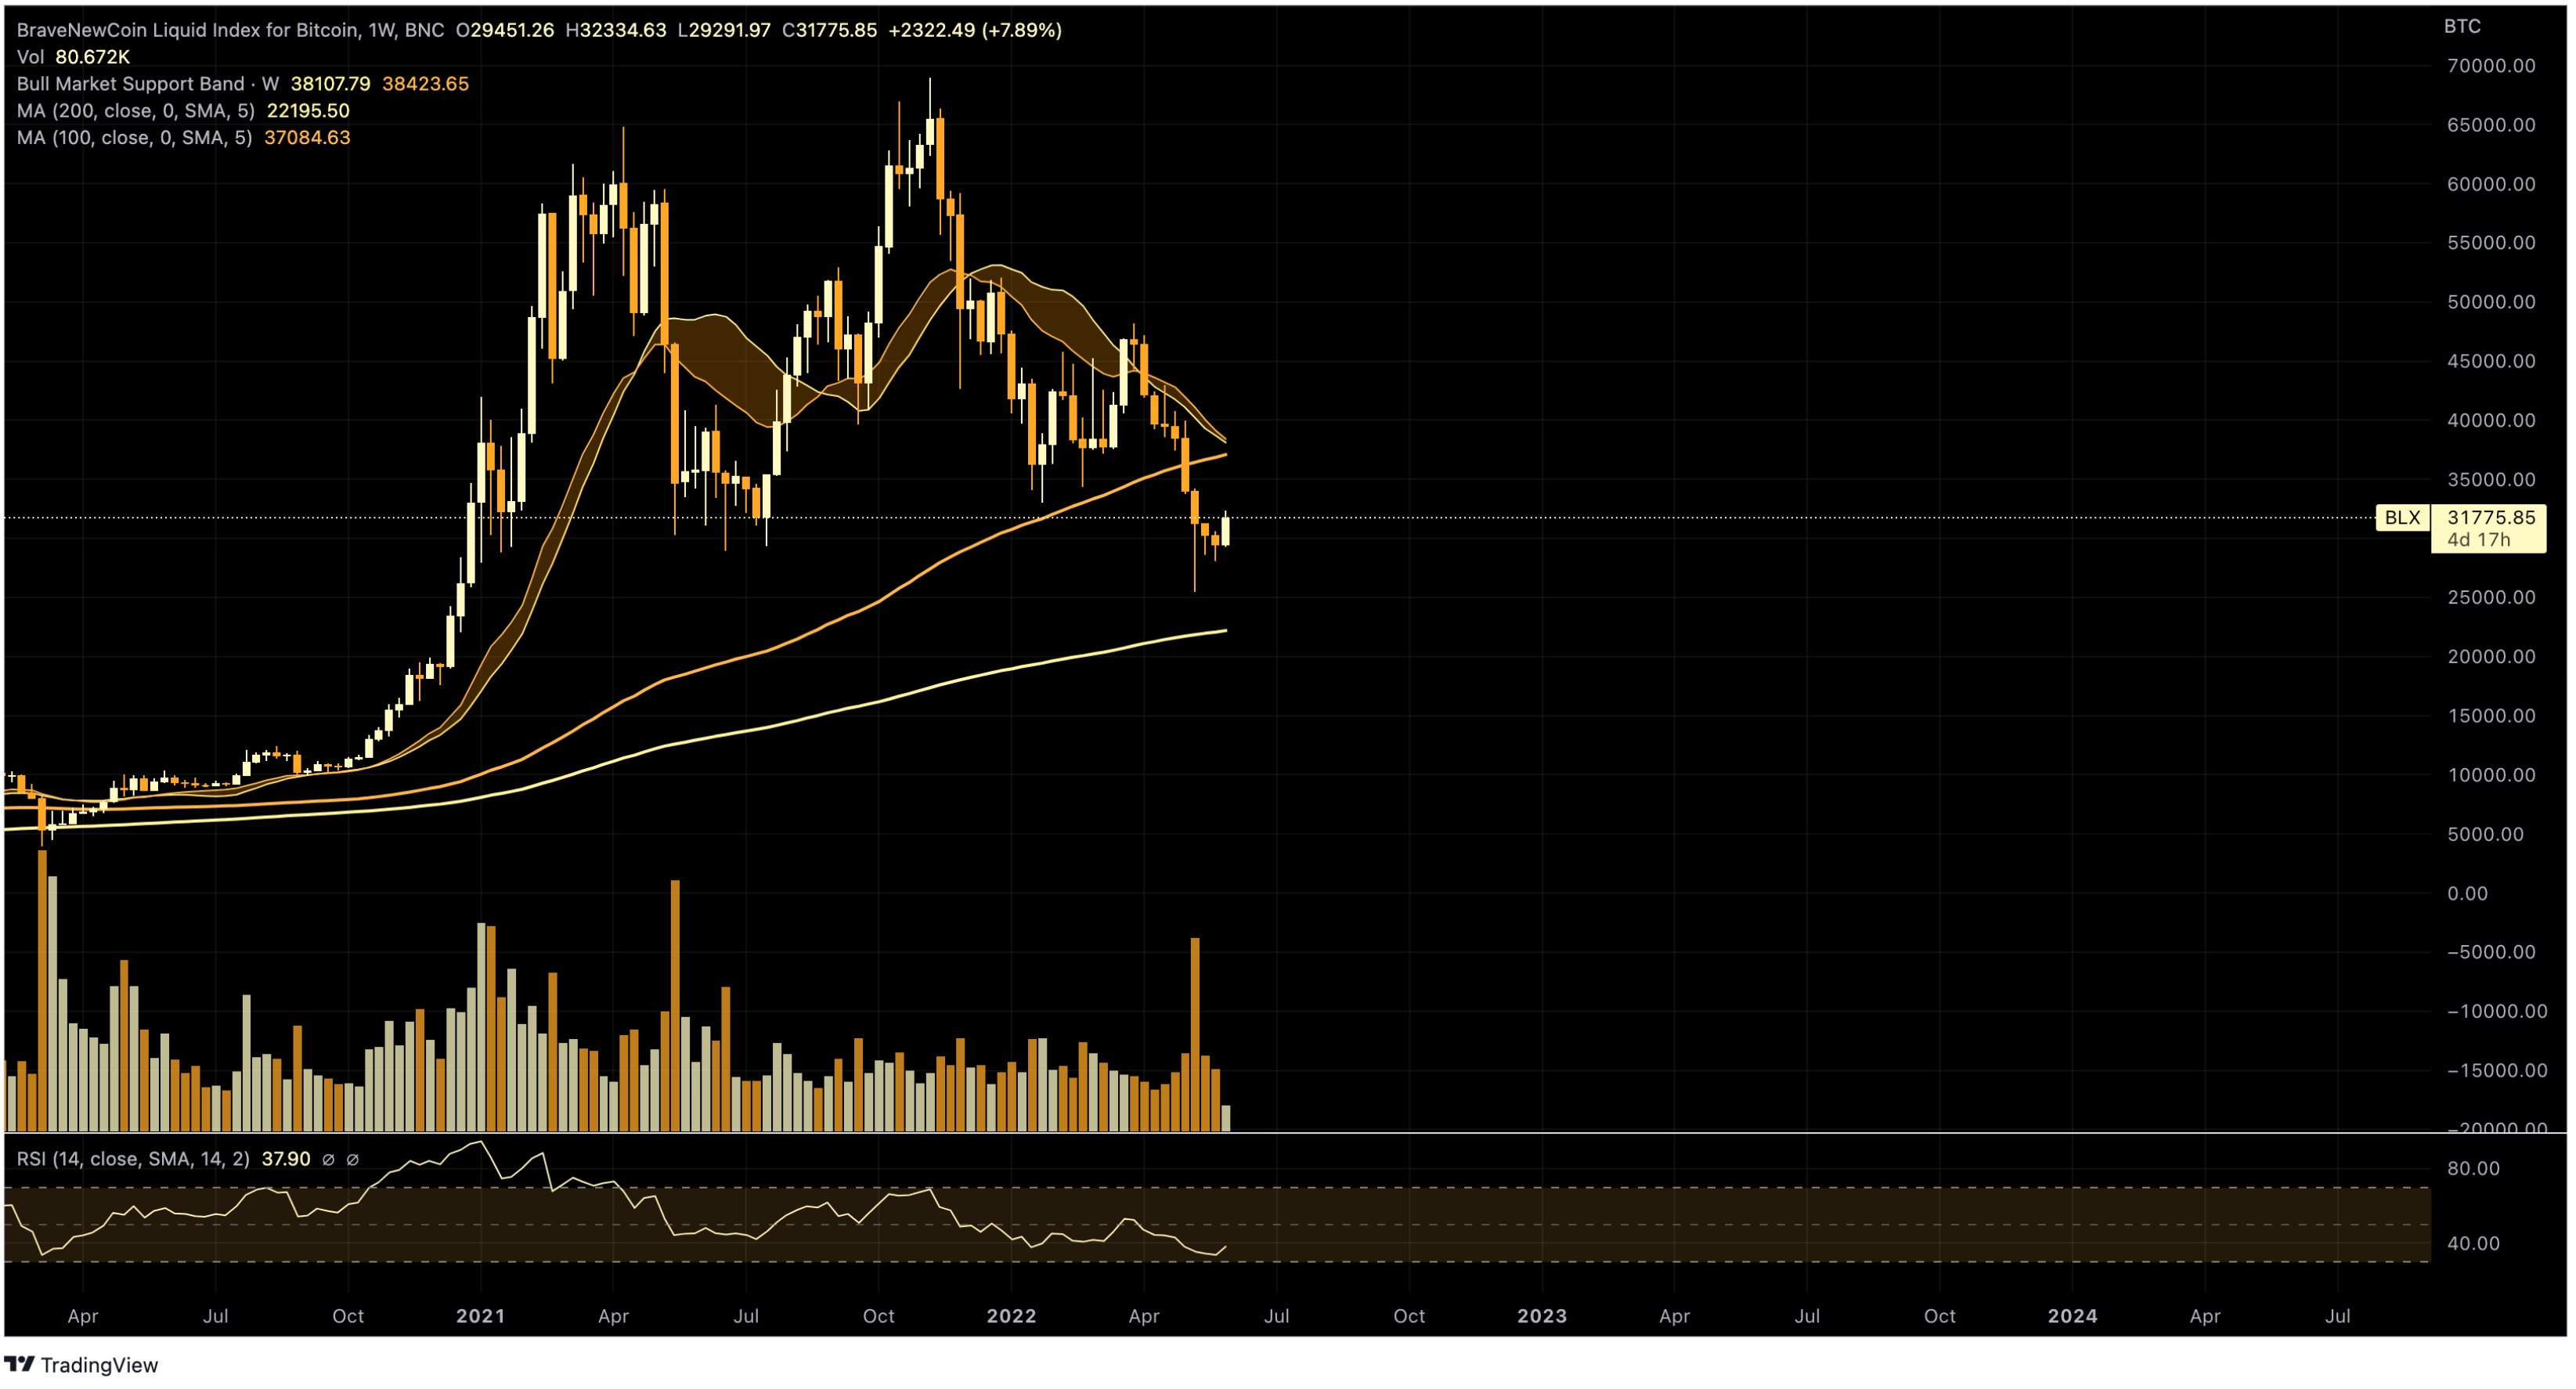
As shown, Bitcoin closed down for the ninth consecutive week this past Sunday, the longest continuous slide in Bitcoin’s history. That said, it is important to contextualize this slide, as I did a few weeks ago:

Little consolation, I suppose, but at least the relentless bloodletting has ceased for the moment. The bigger question of course is whether it has ceased more permanently. i.e., Is the bottom finally in?
Is the Bottom In?
Let me preface this section by saying NO ONE has any idea where price is headed next. NO ONE. The only thing for sure is that price will either go higher or lower at some order of magnitude for an indefinite period of time. It will then reverse direction at some order of magnitude for another indefinite period of time. Whatever the case, NO ONE can reliably/consistently predict such market moves. I don’t care what they claim on Twitter or elsewhere.
Stated differently, retroactive claims about foreseeing a particular price move isn’t particularly remarkable when you think about it. The odds of correctly guessing price direction is at least 50-50: I can “predict” price movements correctly at least 50% of the time simply by always guessing the same direction, or arguably even better than 50% simply by guessing a bullish move, since Bitcoin price history unequivocally shows that price goes up more often than it goes down.
To punctuate my point about how unpredictably market prices move, consider this scenario: If someone were to correctly guess a coin flip, should we then have more faith that the same person would be able to correctly call subsequent coin flips? I think not. I would argue the same logic applies to markets despite the myriad charts and tools people use to try to improve their odds of correctly guessing price direction at anything greater than chance (greater than 50% of the time), particularly when those people employ charts that clearly have no predictive validity.
More specifically, my claim above applies most directly to predictions that are based on hourly (4-hr, 6-hr, 12-hr) and/or daily (1-day, 3-day) charts, which unfortunately are the charts most commonly used by social media influencers. To be clear, such timeframes cannot be used successfully to infer price action simply because there are too many exogenous variables that influence Bitcoin’s price on an hourly/daily basis, especially these days given the level of institutional involvement in the market, involvement that increases by the day. Look no further than the massive intraday price swings Bitcoin experiences based on whether trading is occurring during Asian, European or US market hours.
All this said, I have finally come around to the notion that low-timeframe (LTF) charts are indeed useful for inferring near-term price moves (within minutes) while high timeframe (HTF) charts (months, quarters, years) are useful for contextualizing current price within Bitcoin’s price history. Put another way, I have come to believe that the only thing that matters to PA on LTFs is human psychology, provided of course no exogenous variables intervene during a multi-minute trade. On the other end of the spectrum, HTFs mitigate the impact of all the chart “noise” that appears on an hourly/daily basis due to knee-jerk market responses to short-term events.
With this in mind, I now use technical analysis (TA) to both trade on LTFs and invest on HTFs. But once again, caveat emptor: the timeframes most commonly employed by influencers - hourly and daily timeframes - are most prevalent not because they are actually useful, but because these influencers need to continually generate new content or their influence (read: income) will fade.
Evidence for my thesis, at least with respect to LTFs, lay in my trading record. Stated as humbly as possible, I am having considerable success trading Bitcoin on LTFs. I have made money on 62 of the 86 trades I have executed to date, a success rate of 72%, which is well above chance. And I would argue that this level of success is even more notable given that all of my trades have occurred over the past eight weeks, when Bitcoin has done almost nothing but go straight down (I trade only long, never short).
I mention my trading record only to demonstrate that I am now a firm believer in the utility of TA for LTFs. But given that I have a strong preference for hodling over trading, the question I think many of us want answered is when we can expect a bullish macro trend to resume, or at a minimum, when we can at least expect the current bloodletting to cease. i.e., Should we get out of the market now in the hope of buying lower later and/or is now a good time to buy?
Again, I don’t have the first clue about what the market will do next except on very low timeframes, so let me try to provide some high-timeframe perspective by illustrating where current price is relative to other points in Bitcoin’s history.
Macro Indicators
Among the many metrics I track, one is the Pi Cycle Top Indicator:
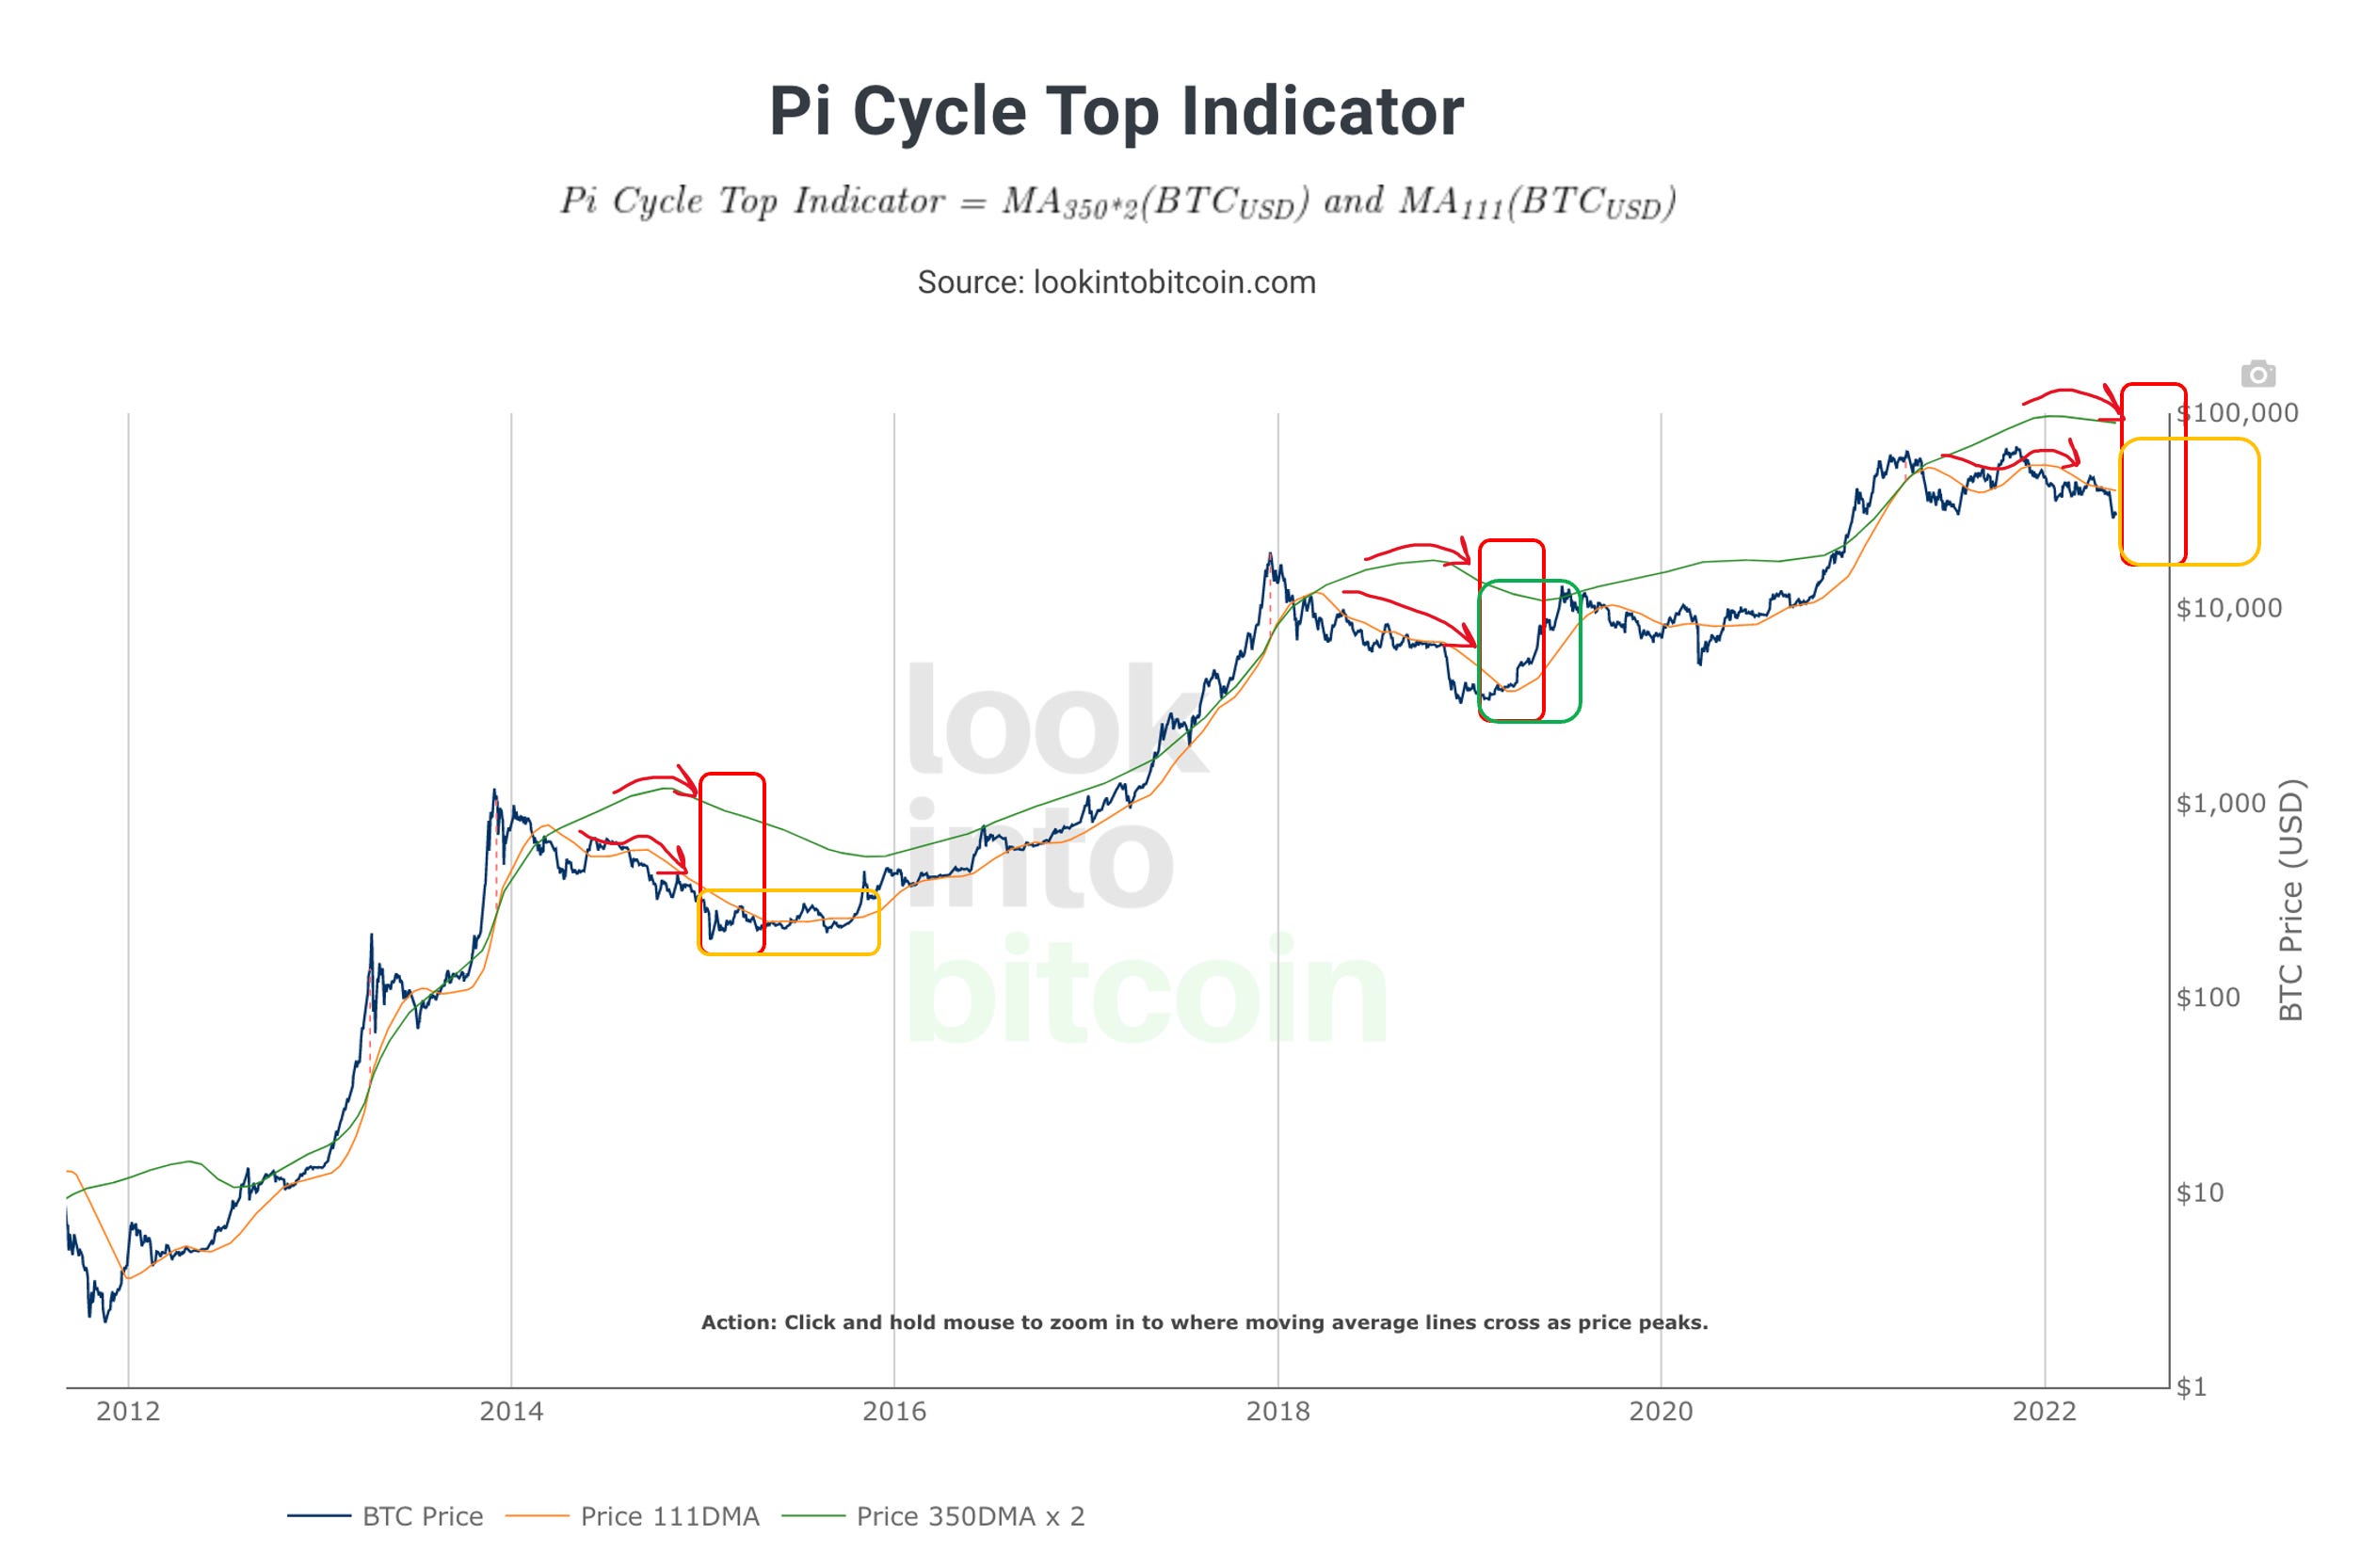
As illustrated above, the 350DMA (green trend line) has sloped downward only three times since 2014, or more specifically, once per halving cycle. In the previous two cycles, the gap between the 350DMA and the 111DMA (yellow trend line) widened considerably over many months before a bottom was finally reached. Note, however, that in the 2014 cycle, price proceeded to trade sideways for several months after a bottom was reached (left yellow rectangle), whereas in the 2018 cycle, a bullish impulse emerged immediately after reaching the bottom (green upright rectangle). Importantly, however, note that the 111DMA resumed an upward trend in both cycles before the next bull run really gained momentum.
Looking at the current cycle then suggests to me that the bottom is likely not yet in, at least not if past PA is any indication of future PA. That is to say, not enough time has elapsed since the 350DMA started its downward trend in early 2022 and the 111DMA is still downward sloping/has not yet resumed an upward trend. As a result, I remain bearish, at least with respect to my interpretation of the Pi Cycle Top chart.
Pi Cycle Top interpretation: bearish
Another useful metric is the MVRV Z-Score, a standardized score comparing Bitcoin’s current market value to its realized value:
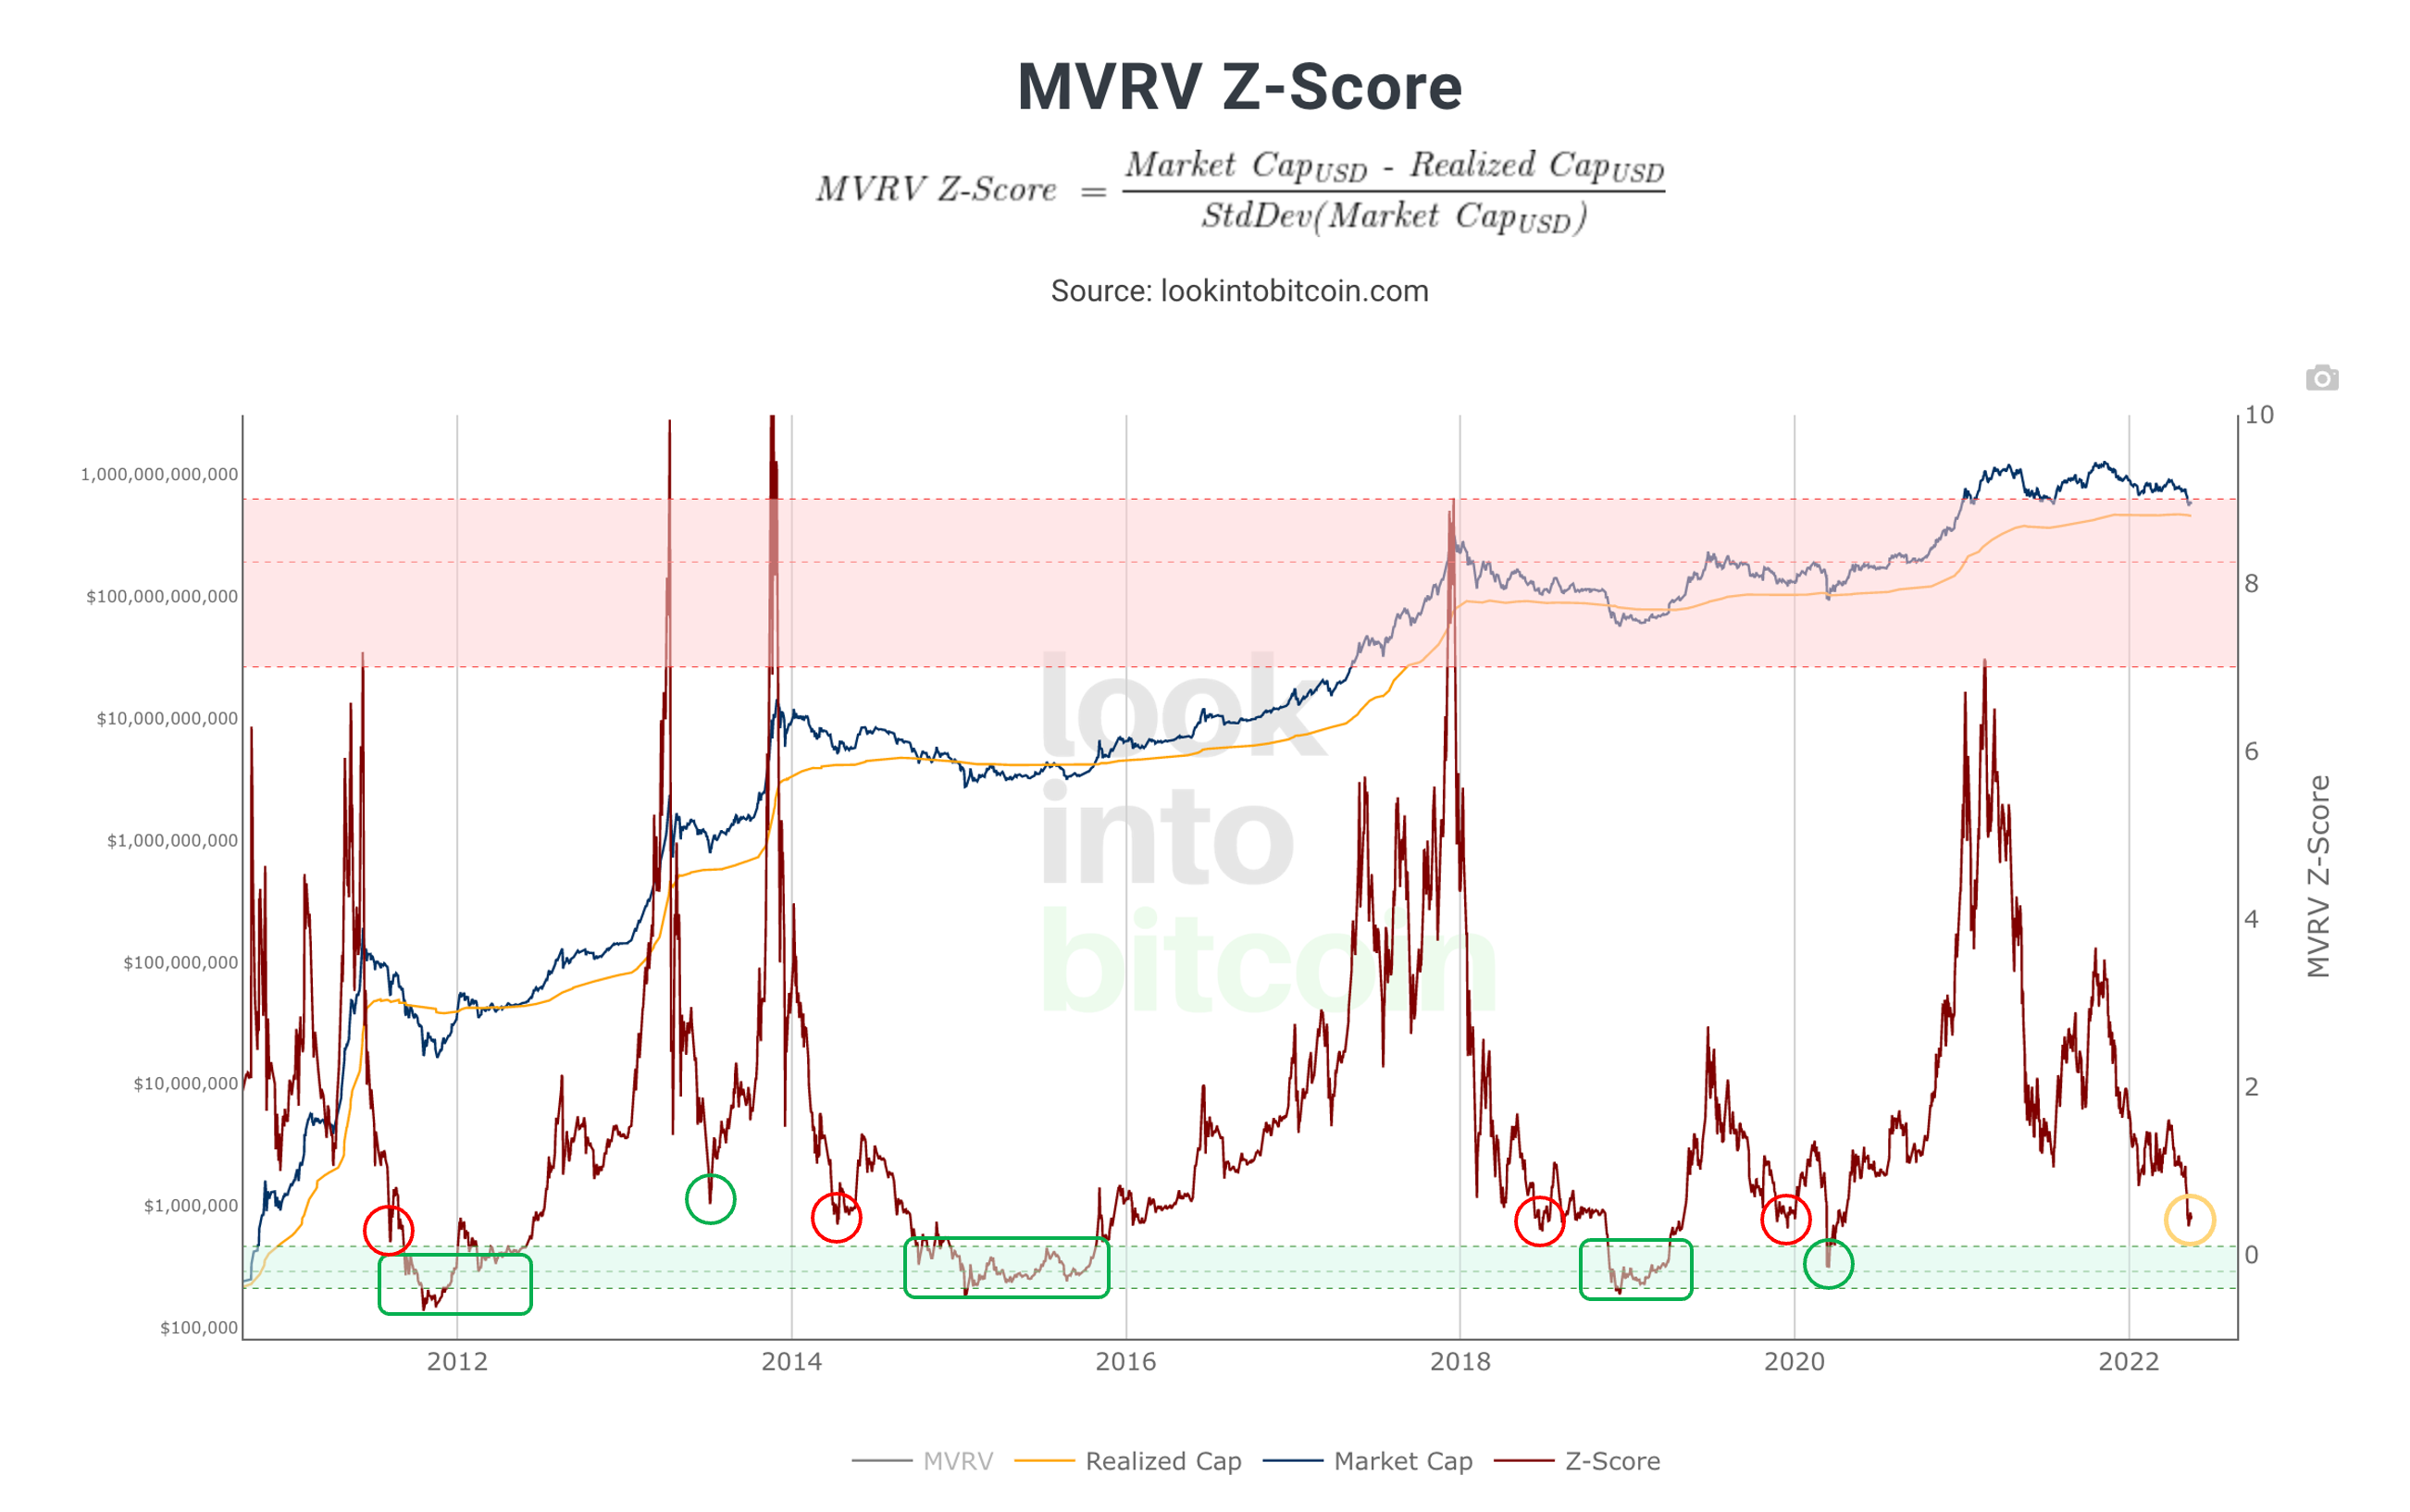
As shown above, the current MVRV Z-score (yellow circle) is quite low historically speaking, which is bullish in an absolute sense. However, it has not (yet?) turned negative (reached the green zone). Looking at the current score relative to comparable scores across Bitcoin’s history suggests that what happens next could go either way (again, if past PA is any indication of future PA, which in itself is debatable). Anyway, as shown, the MVRV Z-score has rebounded from the current level in several cases (the red circles), but note that each of those recoveries proved to be short-lived, with scores reversing their bullish impulses and then entering the green zone, often for an extended period of time (March 2020 being the exception).
One other exception to this trend is mid-2013 (left green circle). Recall in that case that the cycle achieved a double-peak, with the second peak substantially higher than the first. Because market dynamics are very different now compared to 2013, I consider that rebound an anomaly, with the more likely next case being a bullish impulse (relief rally) that is soon followed by a return to the green zone before the current bear market finally ends and reaccumulation begins.
That said, let us not lose sight of just how depressed the current MVRV Z-score is in an absolute sense. In this light, now is a great buying opportunity, at least for those who are willing to ride out the remainder of the current storm. i.e., This low an MVRV Z-score does not necessarily mean price cannot go lower from here, but even if it does, time should heal all wounds. In short, now is clearly a better time to buy with respect to the MVRV Z-score than at almost any other time in Bitcoin’s history.
MVRV interpretation: near-term neutral, mid-term bearish, long-term very bullish
Bitcoin’s logarithmic growth curve is yet another useful metric:
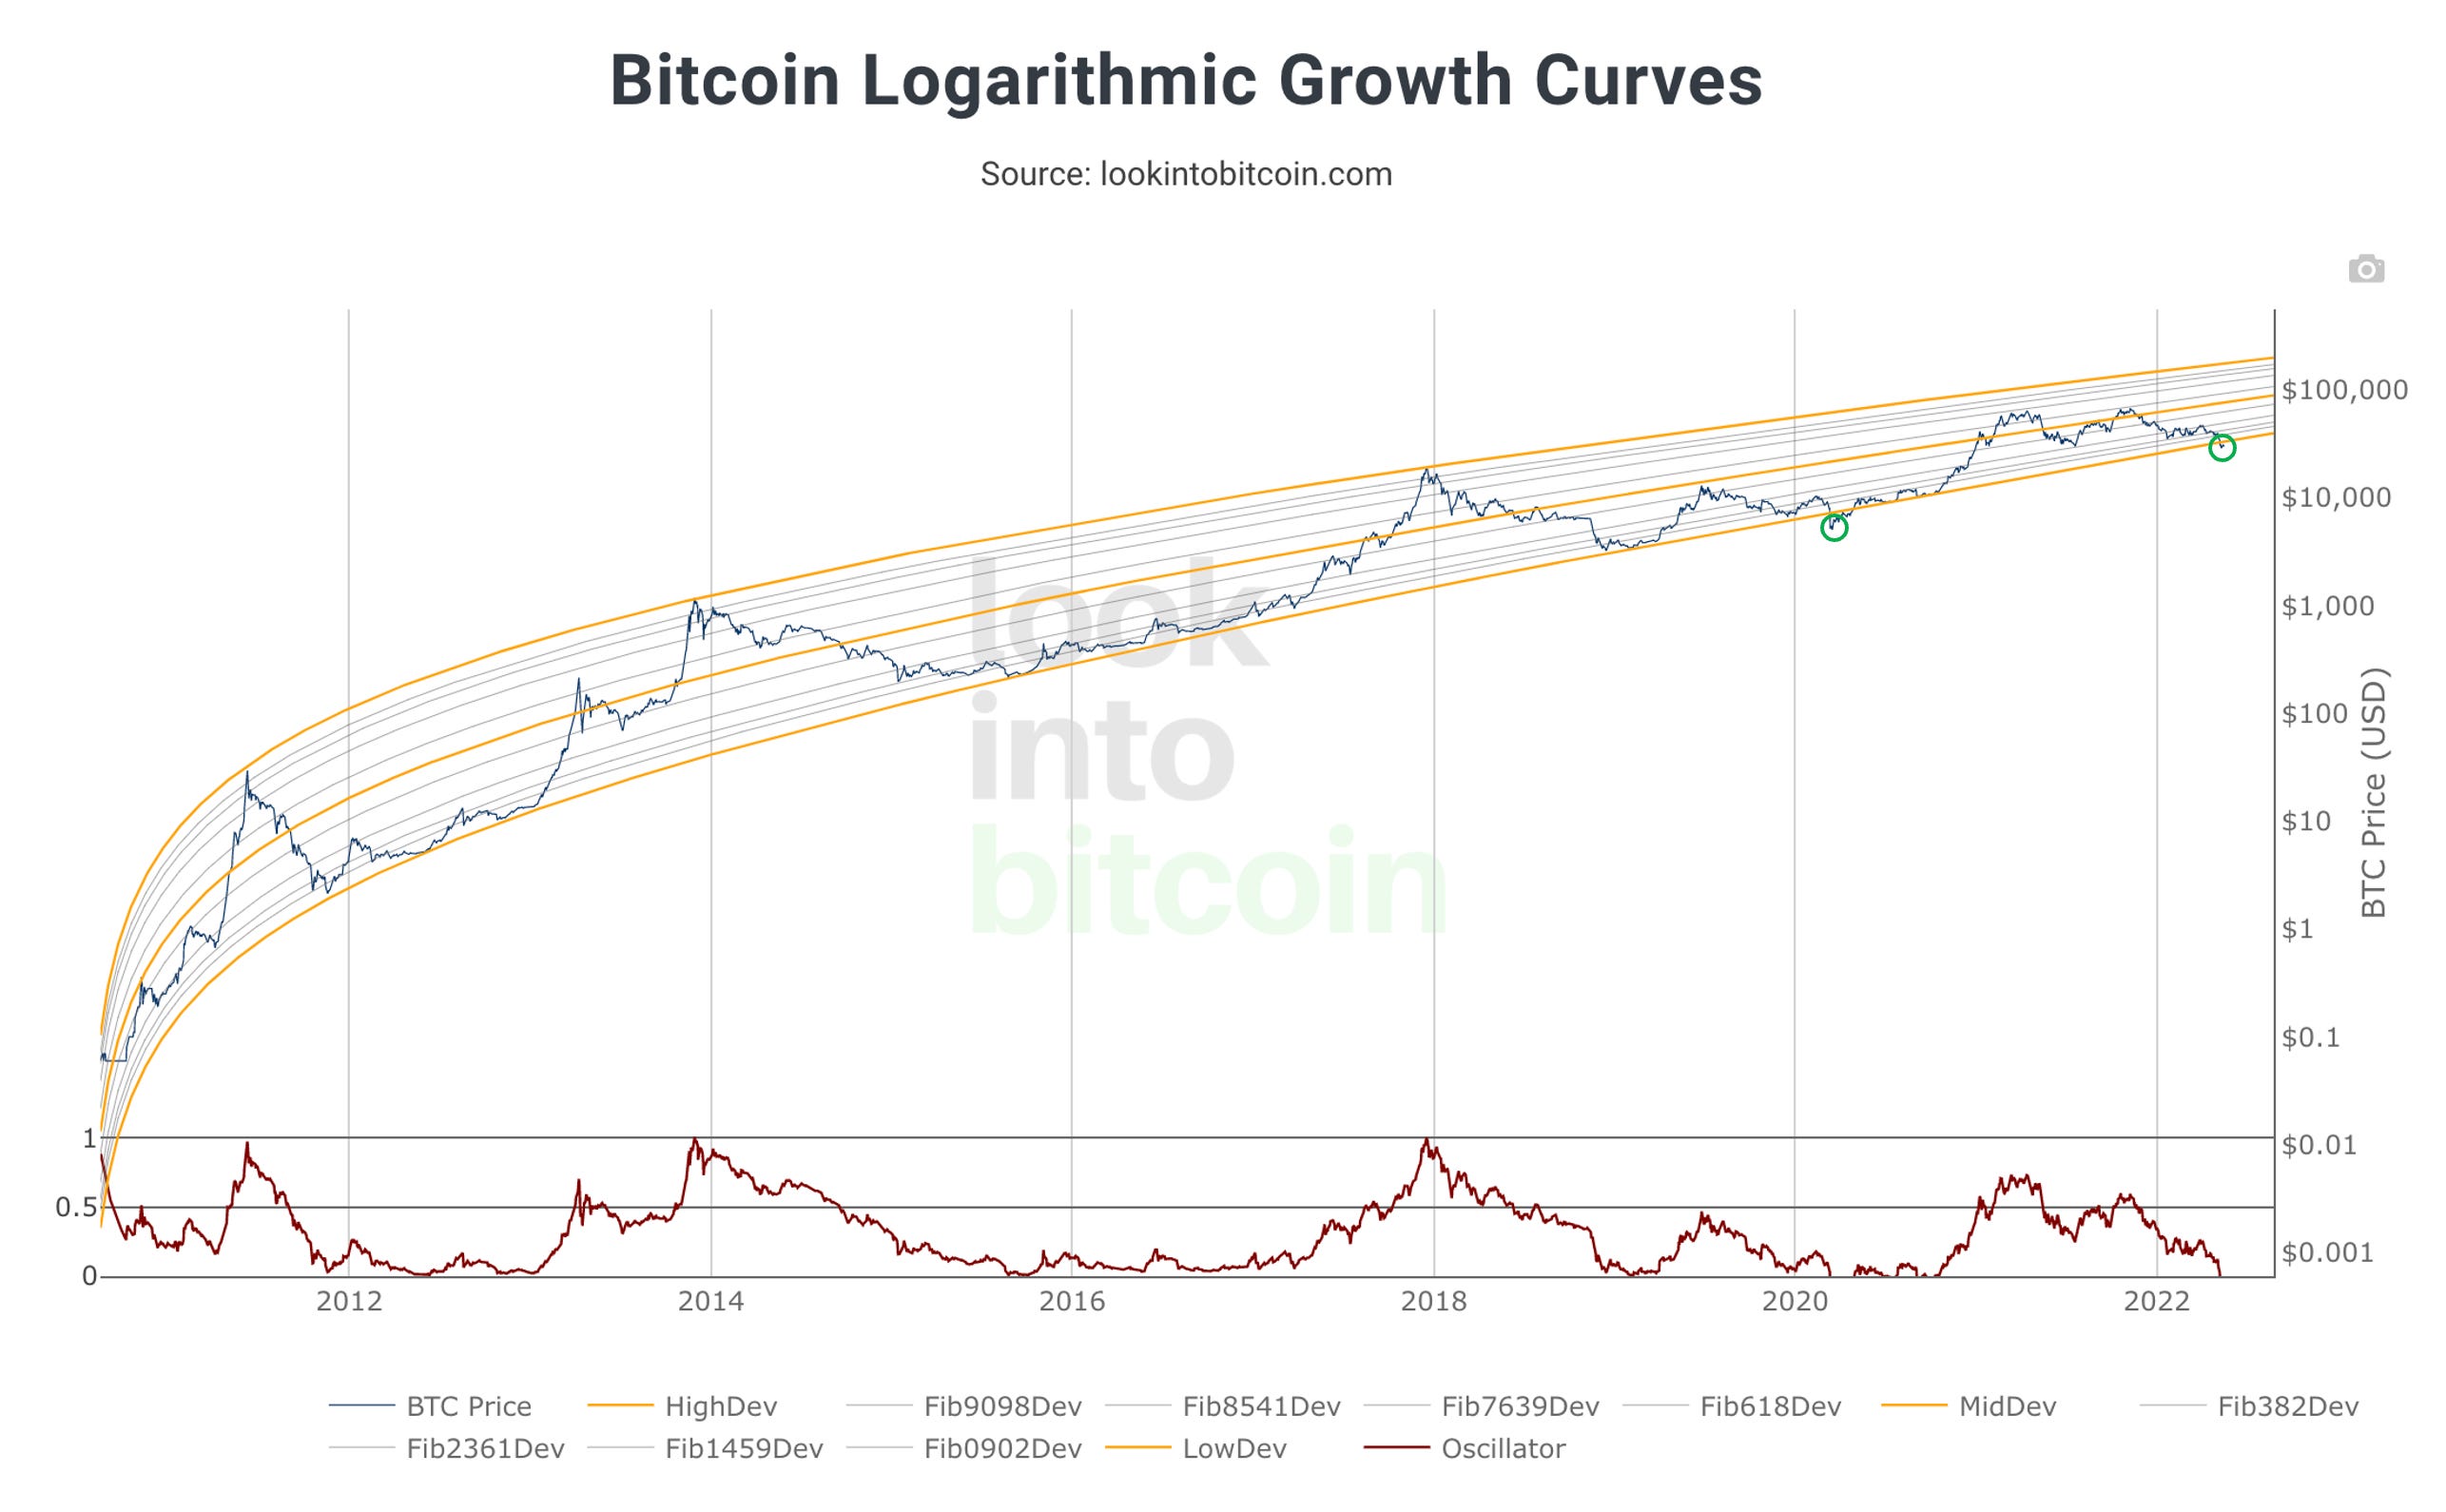
As shown above, price is already at historically low levels with respect to Bitcoin’s logarithmic growth curves, higher than only the March 2020 crash. In this respect, there has almost never been as good a buying opportunity as there is right now. Again, this is not to say price cannot go lower from here - it most definitely can - but buying at this level is very likely going to prove to be an outstanding buy over the long term, provided one is willing/able to ride out the current storm first.
Logarithmic Growth Curves interpretation: very bullish
Yet another useful metric is the Net Unrealized Profit/Loss (NUPL) ratio:
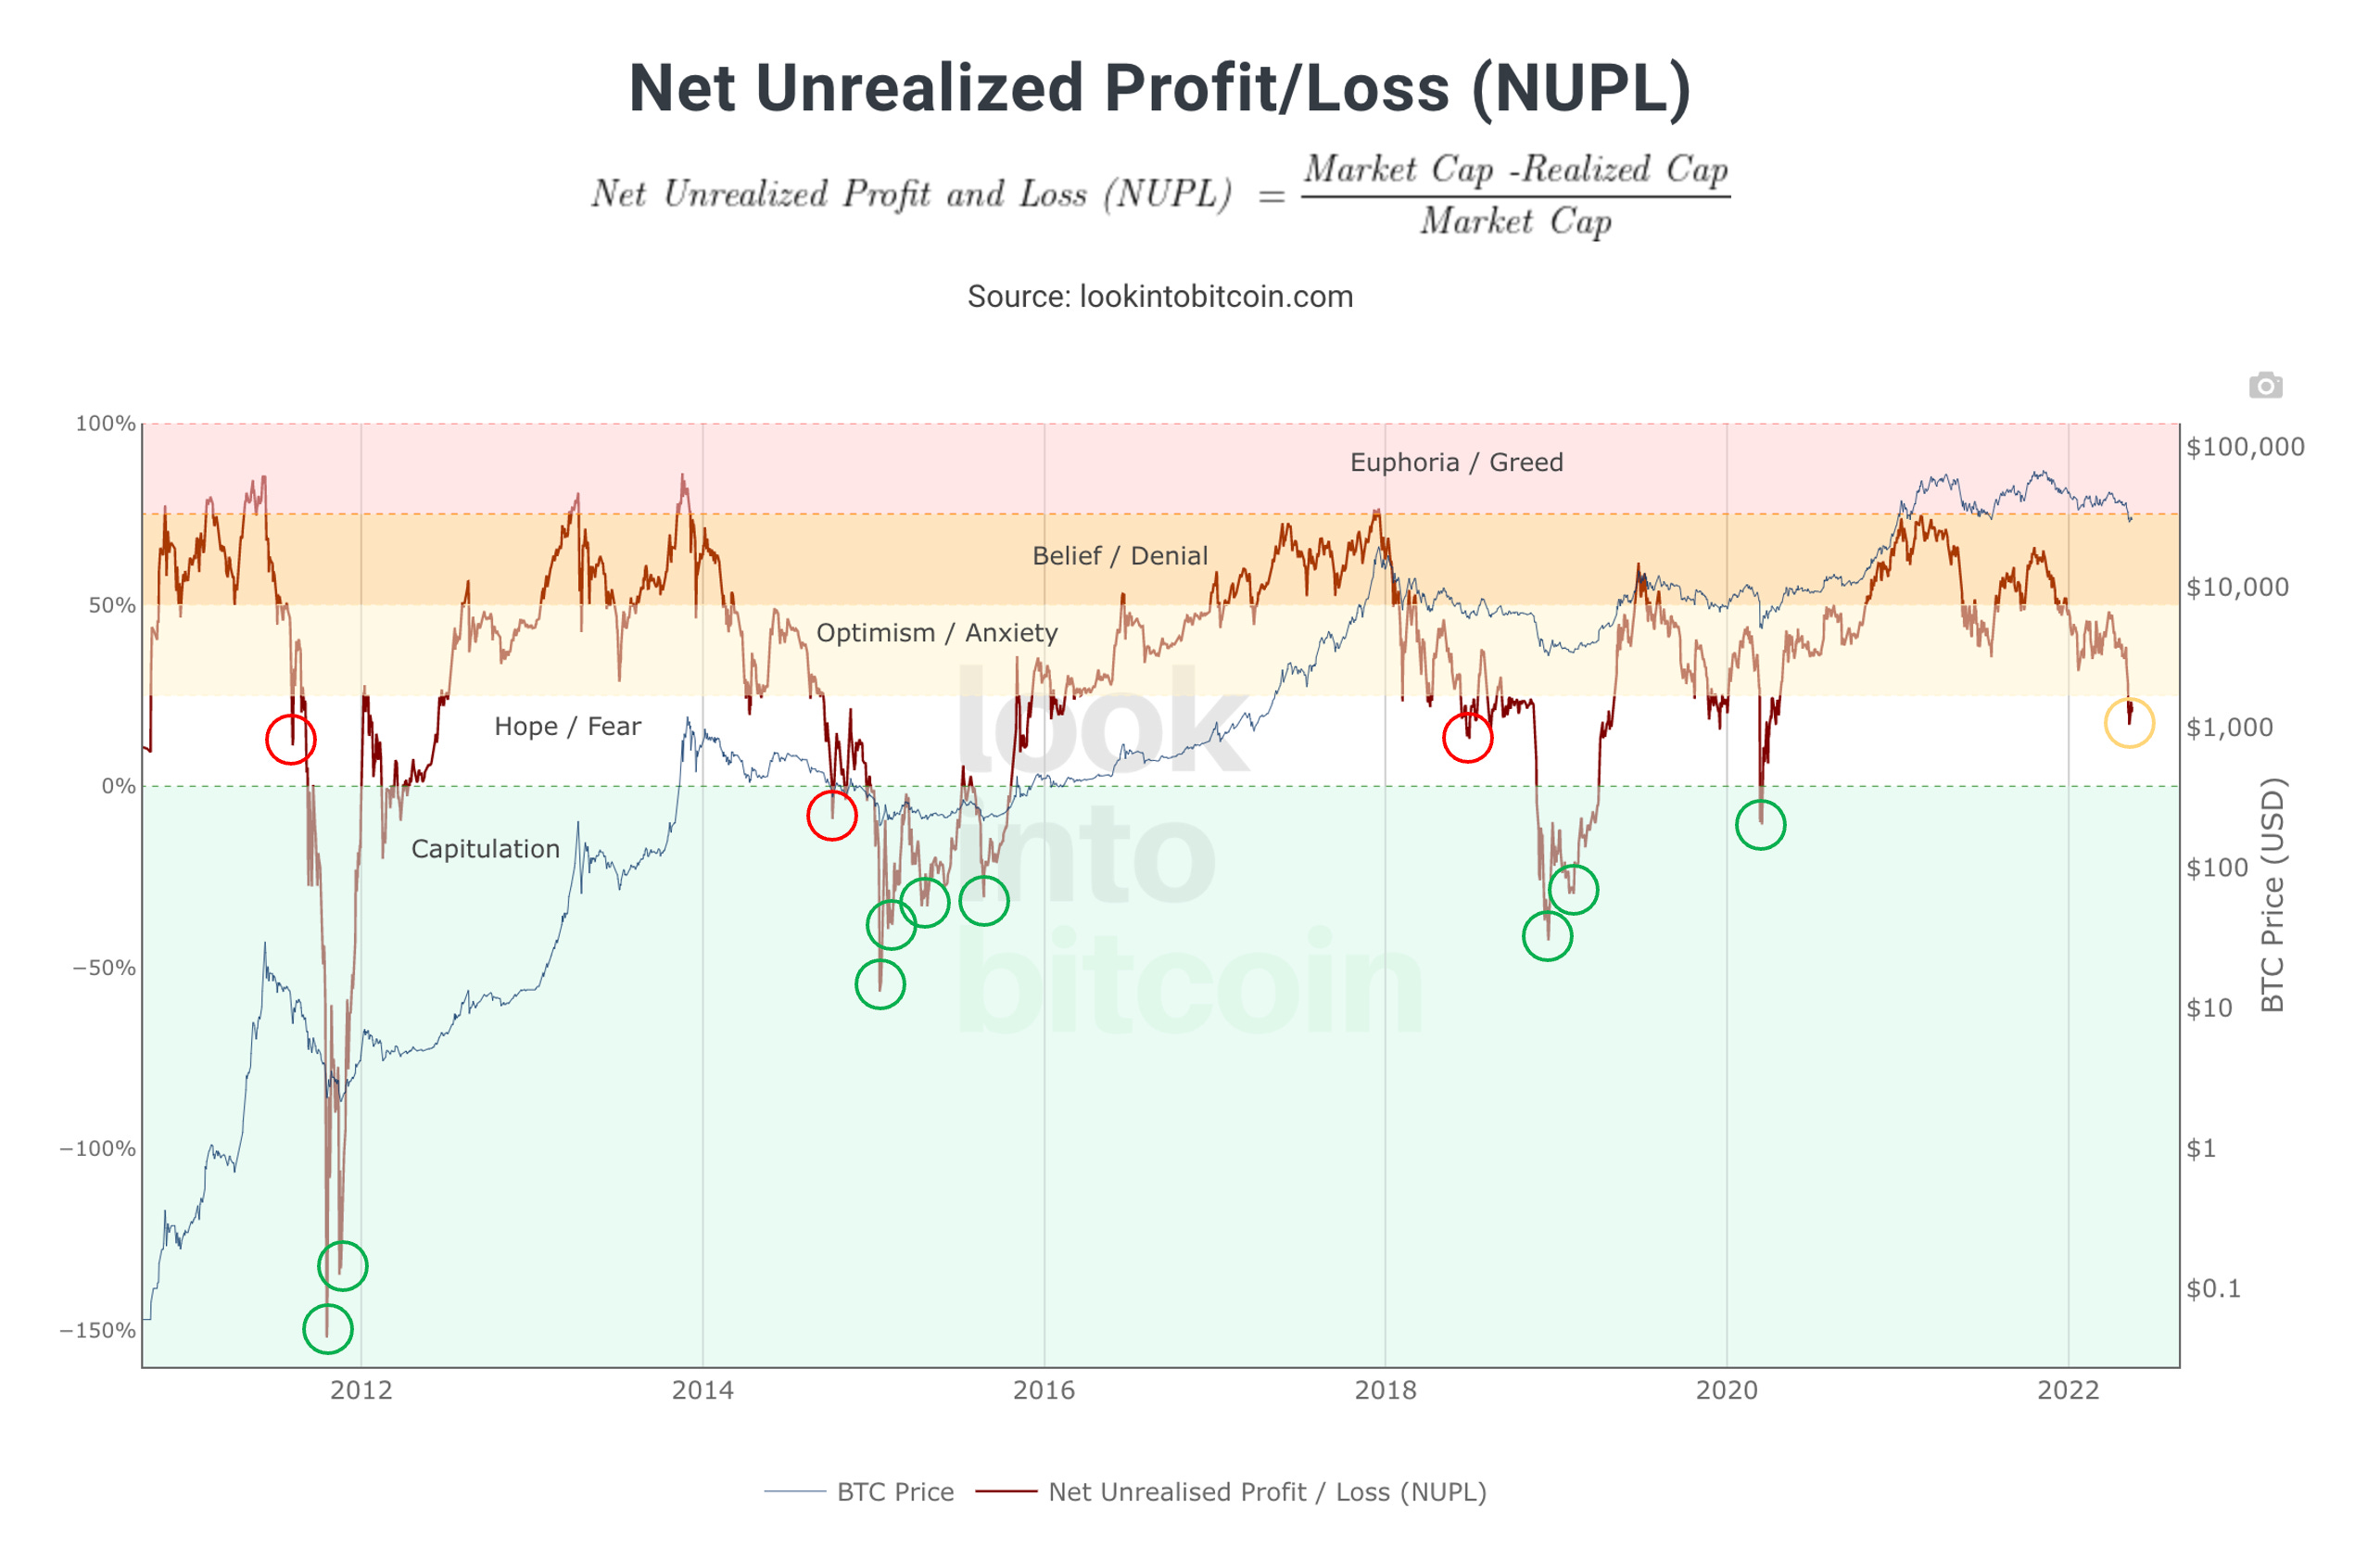
As shown above, the current NUPL ratio yields a comparable interpretation to the current MVRV Z-score interpretation, which is to say that now is a good buying opportunity in an absolute sense. However, it is clear that there is still plenty of room for more downside, as indicated by the numerous dips into the green zone throughout Bitcoin’s history, something that has not (yet?) occurred during this most recent swoon. i.e., If history is any indication, we could get a bullish impulse soon like in 2011, 2014 and 2018 (the red circles), but ultimately, a return to the green zone seems all but inevitable to me, meaning I personally expect more downside from here.
NUPL interpretation: near-term neutral, mid-term bearish, long-term bullish
One final metric I will present here is the Mayer Multiple, which is simply the ratio of the current price and 200-day moving average:
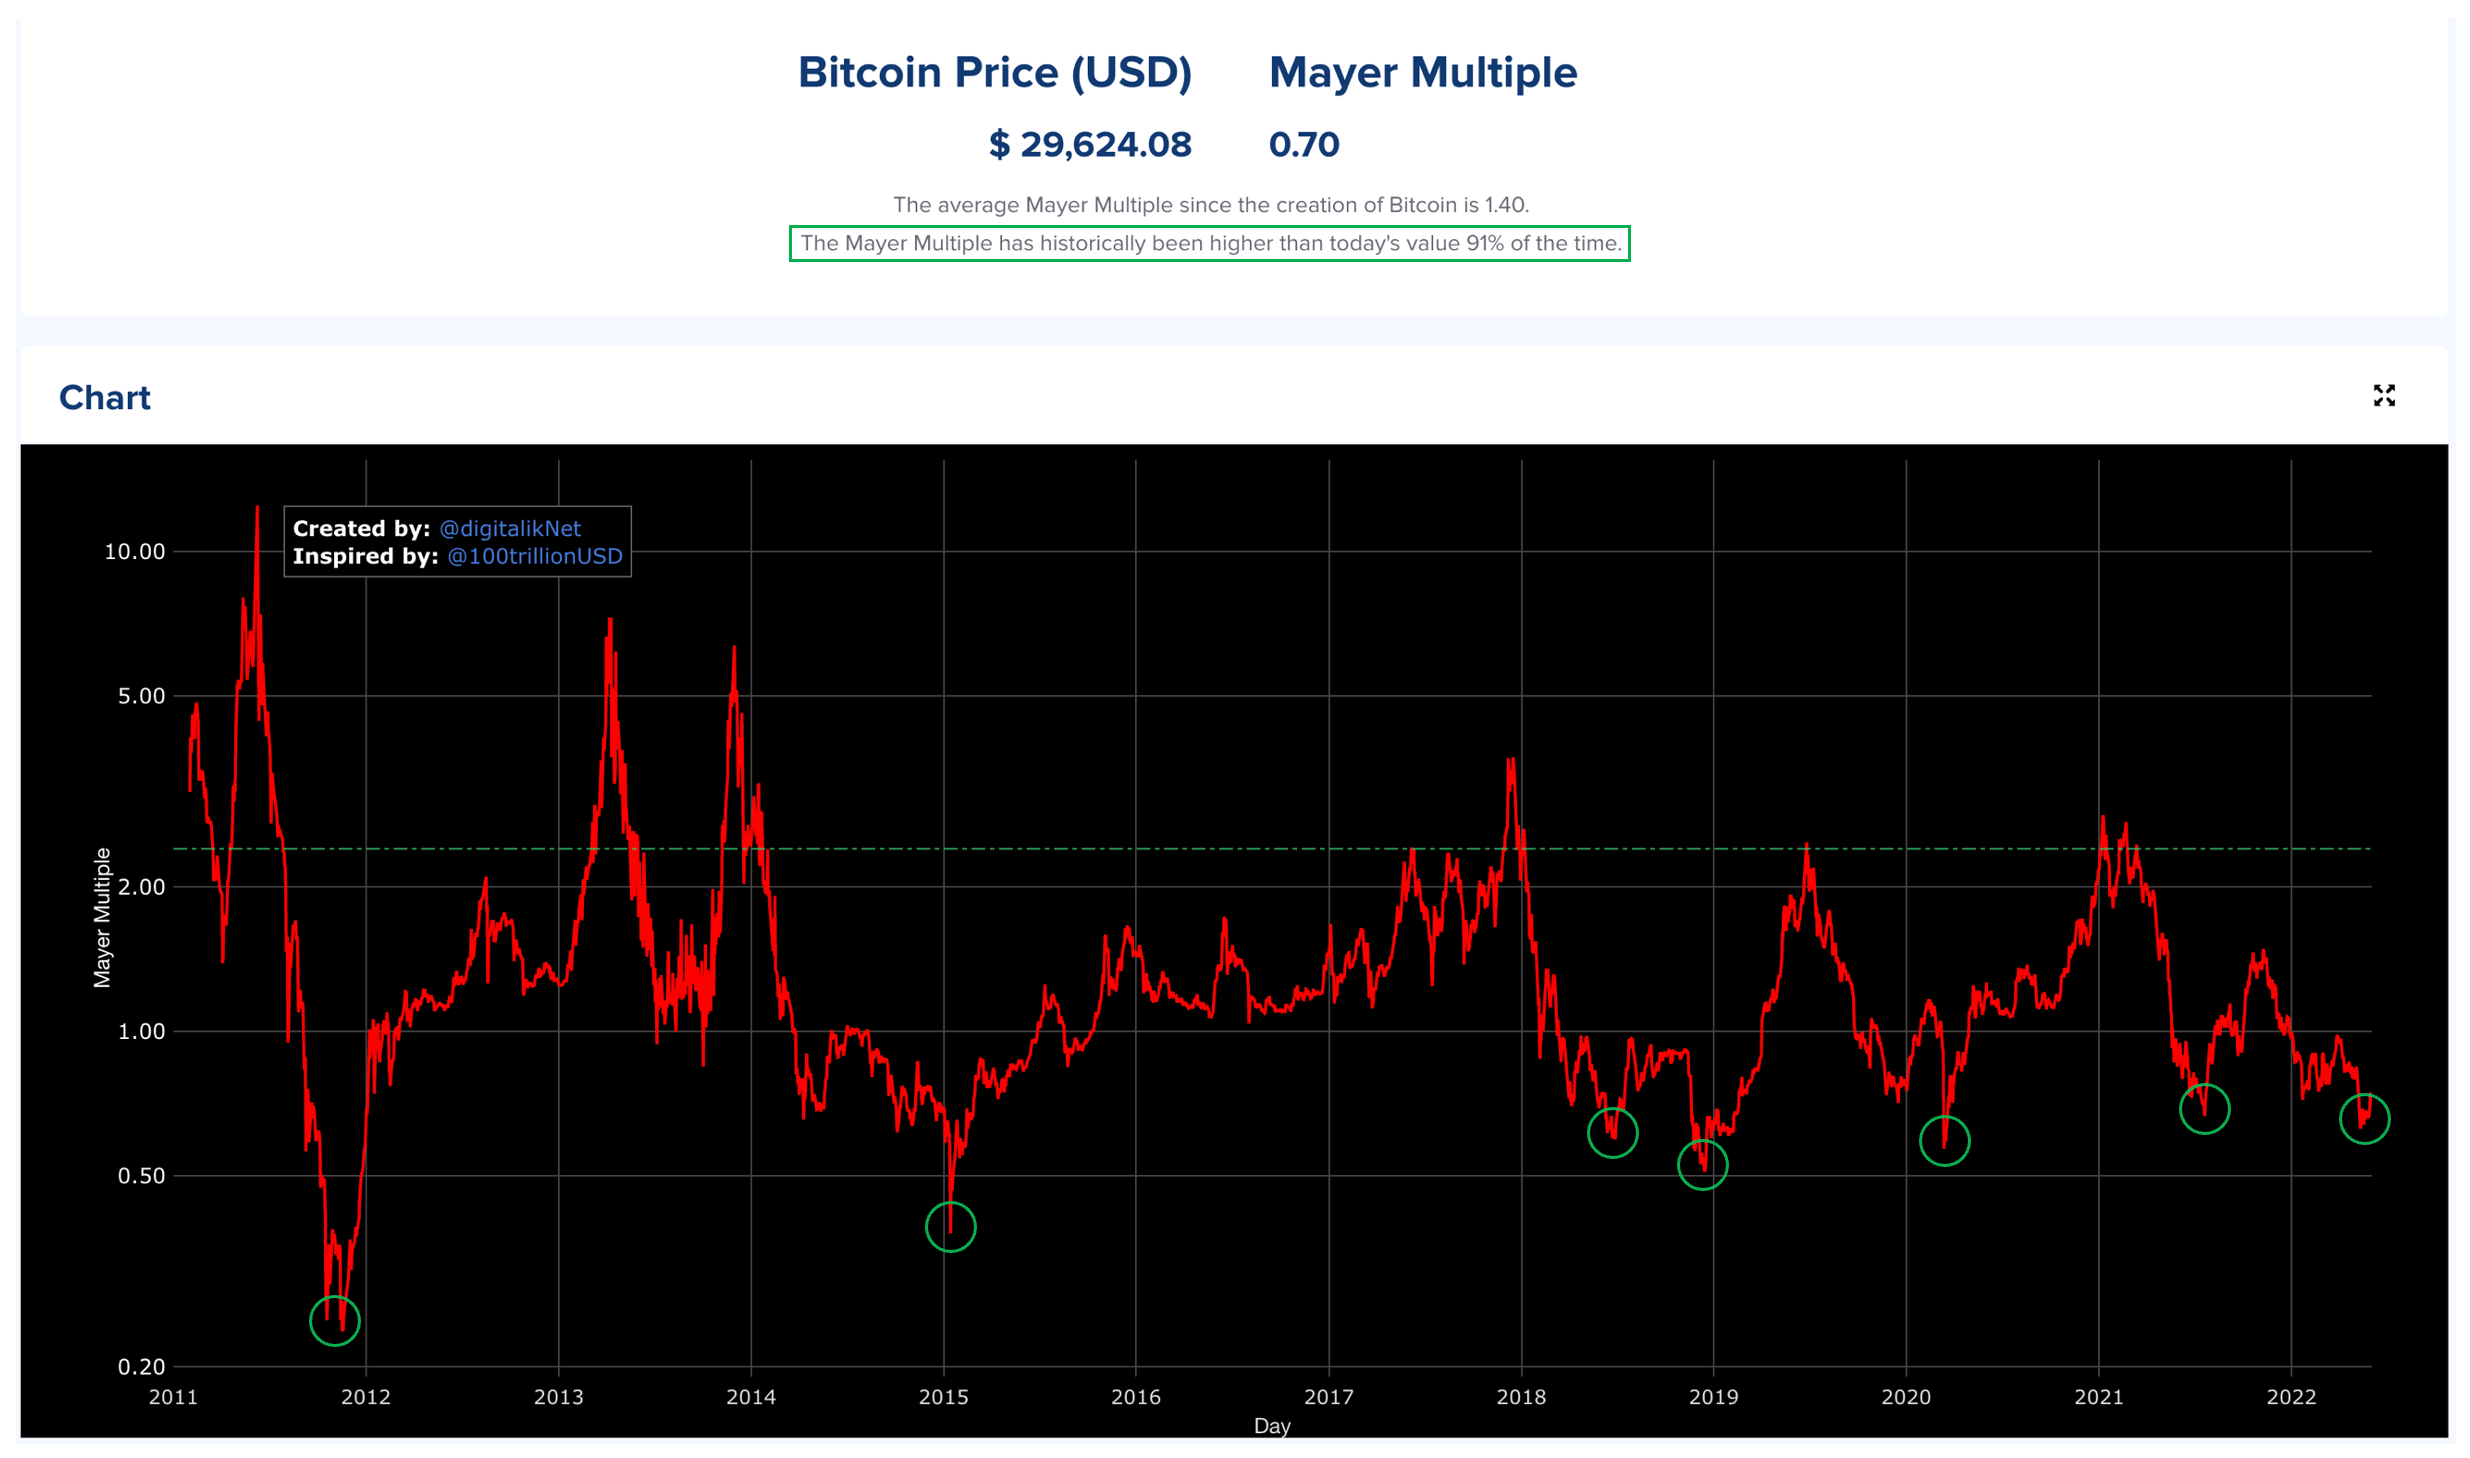
As shown above, now is a great time to buy based on the Mayer Multiple, with the current ratio (0.70) lower than it has been 91% of the time in Bitcoin’s history. Visually, you can see just how low the current multiple is relative to other past nadirs. In short, now is as good a time to buy as there has been in the past several years. In fact, if you look at the green circles (san late-2011), once the Mayer Multiple reaches its local nadir, it rebounds almost without pause thereafter (except for the 2018 double-dip). One could therefore argue that we have indeed reached a local bottom, at least based on the trend of the Mayer Multiple (the most recent nadir for the Mayer Multiple was reached on May 12, when the multiple was 0.63 and price closed at $28,944).
Mayer Multiple interpretation: very bullish
There are numerous other metrics I could share, but I think the ones I have presented illustrate that Bitcoin’s near-term price direction is decidedly unclear at the moment. While the Mayer Multiple recently reached a multi-year low and the Logarithmic Growth Curves imply a near-imminent rise in price, the current NUPL ratio and Pi Cycle Top chart are decidedly less bullish, with past PA suggesting price could drop even more, potentially much more, despite the already depressed price levels. In fact, I would argue this is the reason the Bitcoin Fear and Greed Index is as low as it is:

i.e., I would argue the index is at 13 not because of Bitcoin’s price per se, but because of the extreme uncertainty dominating the market right now. One day price jumps and a palpable sense of relief can be felt across social media; the next day, the market sucker punches buyers, retracing all of the previous day’s gains. During such turbulent times, what are we longs to do?
My Outlook
Given how uncertain market direction seems to be right now, I have modified my own investing strategy to help me better weather the current turmoil. I alluded to my LTF trading strategy above, but let me detail my current outlook and resulting plan of action more fully below, with the understanding that what I describe below works best for me but will not necessarily work for others, depending on one’s risk tolerance, cash flow, investment objectives, time horizon, etc. i.e., None of what follows is financial advice. I offer the following description of my own plan only as food for thought as you try to figure out how you too can best weather the current storm.
First off, I have two overarching beliefs that I think are true and will continue to be true for the foreseeable future:
The US Federal Reserve (the Fed) is wholly incompetent. They repeatedly fail to anticipate seemingly obvious market trends (remember how inflation was supposed to be transitory?), and then they overreact once they realize their original outlook was wrong (rate hikes to infinity!).
Bitcoin market participants are even more irrational than I had realized. Anyone who has followed me for a while knows I once thought Bitcoin’s new price floor was $40K, and then after that gave way, I didn’t think we would revisit the former local low of $33K, yet here we are below even that price. i.e., Bitcoin’s market participants are much more irrational than I had ever imagined they could be, so hodling alone no longer makes much sense to me. It hasn’t for months now, frankly, which is why I am now 55% in cash (having taken profits earlier - I wouldn’t necessarily be a seller here, though. More on this topic in a bit.)
Given my two beliefs above, I remain bearish for the foreseeable future despite any short-term pumps we may experience (like the current 3-day rally). As I illustrated earlier, I do believe in the adage “the trend is your friend until the end.” As a Bitcoin permabull in spirit, the current bearish trend is hardly my friend, but the trend is indeed the trend until it isn’t, right? Look no further than the table below for more reason why my current outlook remains bearish:
As shown above, Bitcoin has corrected every fourth year, and 2022’s PA thus far has done nothing but reinforce my belief that it will follow in the footsteps of 2014 and 2018. Yes, the bottom could already be in. We had pretty significant volume with an intraday capitulation down to $25.4K a few weeks back and price is already down nearly 60% from its all-time high. Then again, the global-macro environment is a mess and showing absolutely no signs of healing any time soon. Why should I not think the remainder of 2022 will remain bearish, especially when combined with the current timing of/location in the Bitcoin halving cycle?
Perhaps the biggest reason for my continued bearish outlook is the fact that price still has not revisited its 200-week moving average recently. As Benjamin Cowen has pointed out on numerous occasions, once Bitcoin closes below its 100WMA (which it did a few weeks back), it has always continued downward from there until it reached its 200WMA. As such, PA something like the following seems all but inevitable to me:
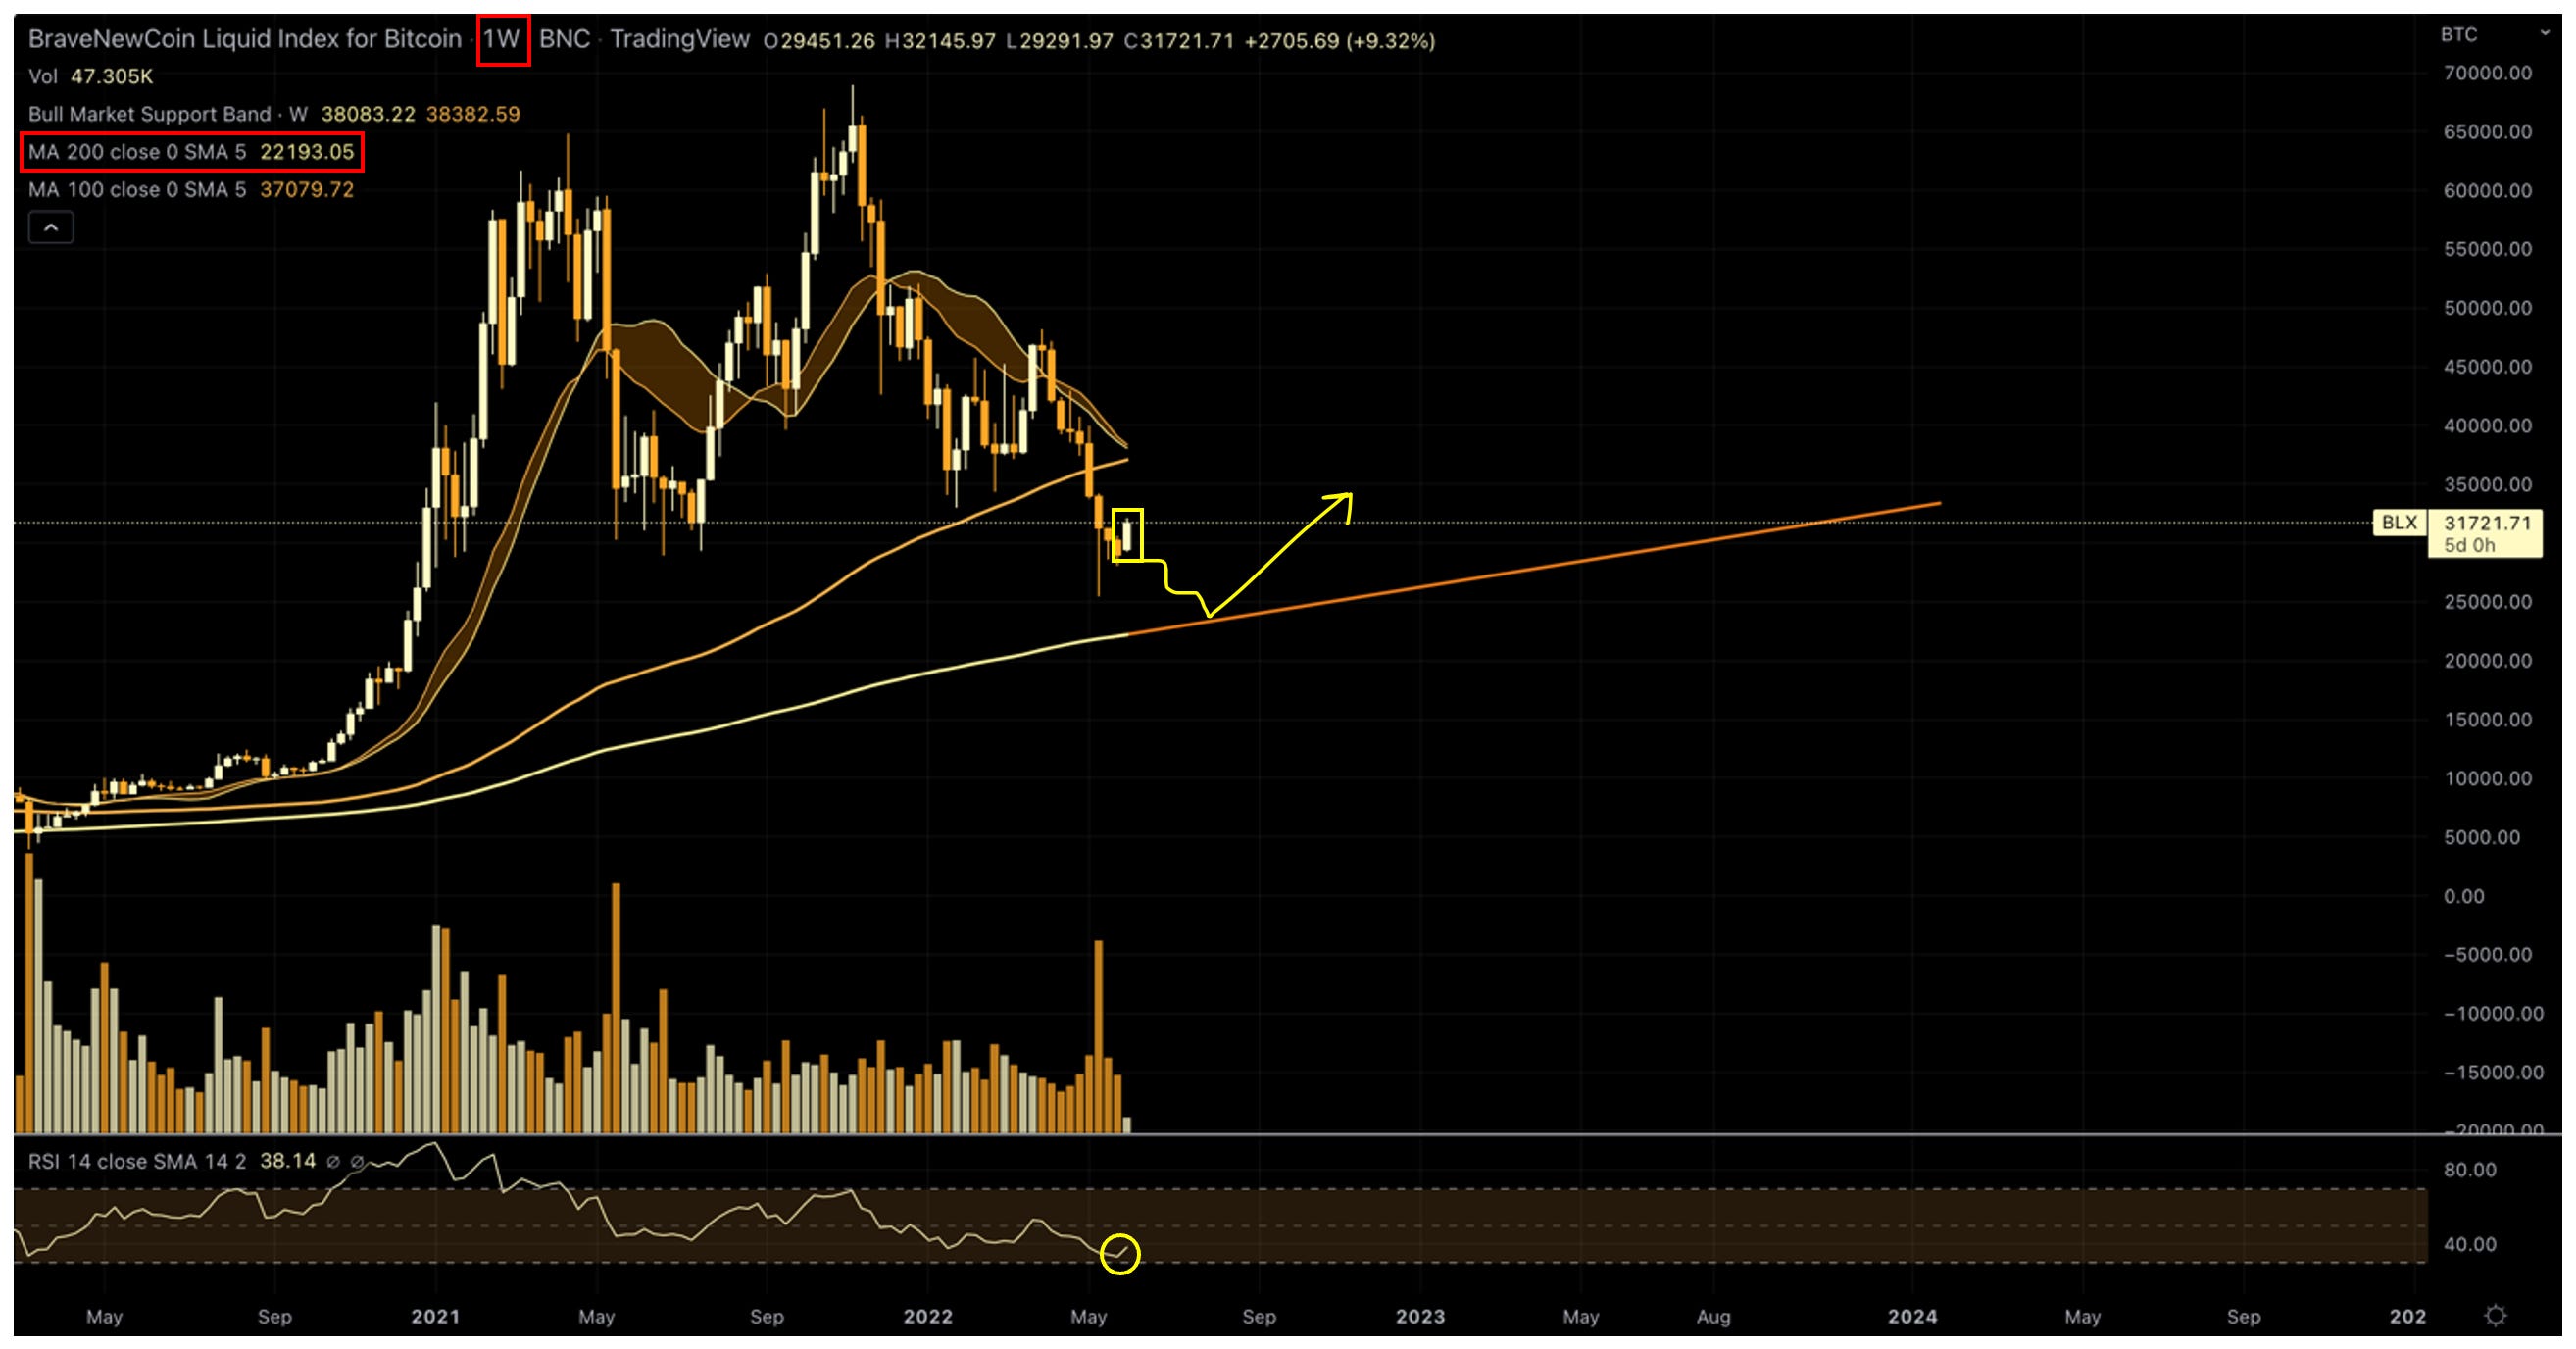
Put another way, current price ($30K) is only $8K higher than the 200WMA ($22K), so it seems perfectly plausible to me that price could drop another $7-8K over the next few weeks/months before bottoming once and for all (NB: because the 200WMA is continually increasing, the longer it takes for current price to revisit it, the higher the price will be when it does. e.g., The 200WMA will be +/- $29K by December).
Again, the trend is your friend until the end, so given everything that is happening in the global-macro environment, combined with where we are in the current halving cycle, I see no reason to believe the worst is behind us. I know, an ugly prognosis indeed. But please take solace in the fact that I was wrong about $40K being the new floor and that $33K wouldn’t be revisited, so I could very well be wrong again.
FOSI/FOBI
I coined a new term a few weeks ago that I shared via Twitter: the Fear of Staying In (FOSI). I coined this term because I consider it to be the true opposite of the Fear of Missing Out (FOMO). While Fear, Uncertainty and Doubt (FUD) is often cited as the antonym of FOMO, it isn’t. FUD causes FOSI. The two terms are not synonymous and the distinction is not merely semantic.
I mention FOSI now (and for that matter, its cousin, which I will coin now - FOBI, the Fear of Buying In) - because many of us are wrestling with one or both of these phenomena as I write. Yes, Bitcoin’s price has already collapsed nearly 60% from its ATH, but couldn’t it drop even more? And if so, shouldn’t we sell (or continue waiting to buy) in the hope that we can buy later at a lower price?
Once again, no one knows the answer to this question. If anyone did, then we all would have sold at $69K by following their advice and then be waiting with bated breath for them to tell us when the bottom is in. But most of us didn’t sell at $69K (or anywhere near it), did we? As such, we are all now left wondering what to do next.
FOSI/FOBI. The fear that grips all but the most ardent Bitcoin maximalists.
The argument I would make in favor of holding strong (or buying in) at this point is simply this: Bitcoin’s price history suggests that current price is almost certainly closer to the bottom than it is to the November 2021 ATH. In other words, given that price is already down nearly 60% from the ATH - and especially without a blow-off top preceding it - one can convincingly argue that the bottom is either already in or very nearby. Moreover, as I have illustrated, many metrics like the Mayer Multiple and Logarithmic Growth Curves chart heavily support this claim.
On the other hand, price still hasn’t revisited its 200WMA, a price that has held support every time it has been visited throughout Bitcoin’s history. i.e., The 200WMA has thus far proven to be the ultimate multi-year buying opportunity. In this light, if price were to visit it again, and relatively soon, that would mean price would drop yet another 27% from the current price, unbelievable as that seems. And if there were to be a vicious intra-week wick below the 200WMA, as has happened on a few occasions? Price would fall another 30-35% from current levels, bringing the total drawdown to more than 70% overall. Who wants to endure another 30% drop after already suffering a 60% drop? FOSI/FOBI. Two phenomena that are as real as they come, especially for the Bitcoin class of 2022.
My Plan of Action
I will conclude by summarizing my plan of action given my current market outlook. As I mentioned earlier, I am currently 45% invested, with 55% of my investable funds sitting on the sideline (I sold all of my altcoin positions and some of my BTC stack on the way down, when BTC was still in the upper $40Ks. I also have some ETH staked on the Beacon Chain). Of the funds I have available, about one-third is in traditional checking and savings accounts (more-or-less set aside for upcoming living expenses now that I am retired); one-third is in USDC earning a yield; and the final one-third is sitting on an exchange, which I use to trade on LTFs. So to reiterate, no, I do not think we have reached a macro bottom. Otherwise, I would be near fully invested. Instead, I will stay at least 50% in cash until I think we have reached a macro bottom OR a bullish macro uptrend clearly resumes. So, how will I know?
If you had asked me six weeks ago, I would have said we had already bottomed, but that perspective obviously proved incorrect, and not by a little. I have thus ceased trying to guess where price is headed next and instead am waiting to see whether we will get what I consider to be a multi-year buying opportunity, which for me would be a revisit to the 200WMA, preferably accompanied by visits to the green zones on the MVRV and NUPL charts. In the meantime, I will continue trading using LTF charts and generating as much yield as I can to try to offset the ravages of inflation. Then, when price either revisits the 200WMA or a bullish macro trend resumes, I will pile back in and hodl until I think we reach a macro top, a topic on which I will happily pontificate at the appropriate time.
Conclusion
Because I always try to find something positive in all circumstances, the silver lining for me with respect to the current bear market is that I have finally removed the veil over my eyes - that somehow one can/should only invest in Bitcoin if you are a diamond-fisted maximalist who considers Bitcoin the panacea for all the world’s ails and thus always and only “stacks sats,” never even considering selling. Nonsense. I am as much a maximalist in spirit as anyone else - I really do believe in its potential to right at least several of the current economic wrongs - but I also still need to put food on the table. Because Bitcoin’s price will continue to be volatile for the foreseeable future, and exceptionally so at times, there simply is no reason to suffer through such massive swings in price by only hodling. In fact, for those with time and aptitude, I would argue it is foolish to do so.
Again, none of this should be construed as financial advice, but for me, given that I am retired and seem to have a pretty good understanding of the rhythm of the market, particularly on very low timeframes, I would be foolish not to trade at least part of my investable capital. i.e., I have decided that I am willing to pay a higher price later once a bullish macro trend resumes if it means I can greater utilize my existing funds during these vicious bear markets. As the saying goes, bull markets make you money, but bear markets make you wealthy. Seems true in my experience, and especially with Bitcoin, so that’s what I am going to do - make sure I take profits in especially frothy times so I can take more advantage of the swoons that inevitably follow.
I will close by preempting what I know will be a question on many of your minds: no, I will not share my LTF trading strategy. As much as I would like to, there are several reasons I have decided to keep the strategy to myself:
It is not an exact science. Even though I employ specific technical signals to make buy/sell decisions, I combine these signals with my intuition based on market sentiment and other trends of the moment. i.e., My strategy isn’t something I can easily explain in writing or even across a series of videos.
I use very low timeframes to make buy/sell decisions, so timing is critical. i.e., My buy signal only triggers two or three times a day, so I need to move fast when it does, even if in the middle of the night, as is often the case.
I am not a financial advisor and cannot offer financial advice. Despite all of my disclaimers and proclamations reiterating this fact, I would never be able to live with myself if someone tried to employ my strategy and lost money as a result. I realize it wouldn’t be my fault per se, but I empathize deeply with others, so I wouldn’t be able to shake the fact that someone lost money trying to employ the strategy I espouse. That said, I am ambitious if nothing else, so I do oneday hope to create an investing club or fund that I could manage on other people’s behalf, but that day is not today.
Finally, if I were to share my strategy and it actually worked for many others, I would lose my trading advantage! While this is the most selfish of reasons to keep the strategy to myself, it is a legitimate concern, especially because I am retired now and hodling alone apparently isn’t going to make me fabulously wealthy any time soon.
I will close for now. This month’s analysis is a mouthful, but hopefully everyone can find something of value, especially those of us suffering from FOSI/FOBI at the moment. Again, NO ONE can reliably predict market moves over anything other than the next few minutes (OR the next several years), but that doesn’t stop people from claiming otherwise. I hope that by sharing my own outlook and strategy, you too can figure out the best way to endure these rough patches, of which there will be many more over the coming years. But so too will there be many glorious times. Of that, I have no doubt.
Good luck with your investing, and of course…
Go #BTC.
Excellent analysis David! Thank you!