
Disclaimer
The data I use (BitInfoCharts, Coinglass, CoinMarketCap) to compile the tables and graphs contained in the on-chain section of this analysis do not always align with data found via others sources like Glassnode and CryptoQuant. I cannot explain the reason for the differences nor can I confirm which sources are most accurate. For this and other reasons, I have come to trust only the on-chain data I collect when trying to explain and/or predict Bitcoin’s (BTC) future price action (PA). Whether you too find my on-chain analysis useful is for you to decide, but I can assure you that some of my observations and/or predictions will differ, often markedly, from other observations and/or predictions you will see on Crypto Twitter (CT) and elsewhere.
Price Action
Unfortunately, I just haven’t found the time to write a full analysis for August. As such, following is very brief commentary, pointing out a few noteworthy highlights. Hopefully I’ll have more time to write a more complete analysis next month.
Here are the price data for August 2024 (from BLX):
Open: $64,614
High: $65,554 (August 1)
Low: $49,514 (August 5)
Close: $59,000
Change: -8.71%
August was a very volatile month price-wise, due mostly to the selloff that occurred after Japan unexpectedly raised interest rates to try to prop up the flagging Yen. That said, price recovered reasonably well, closing just under $60K. Of course, $60K is an important level psychologically, but longer-term, it’s irrelevant.
Below are monthly returns organized by calendar month and halving, respectively:
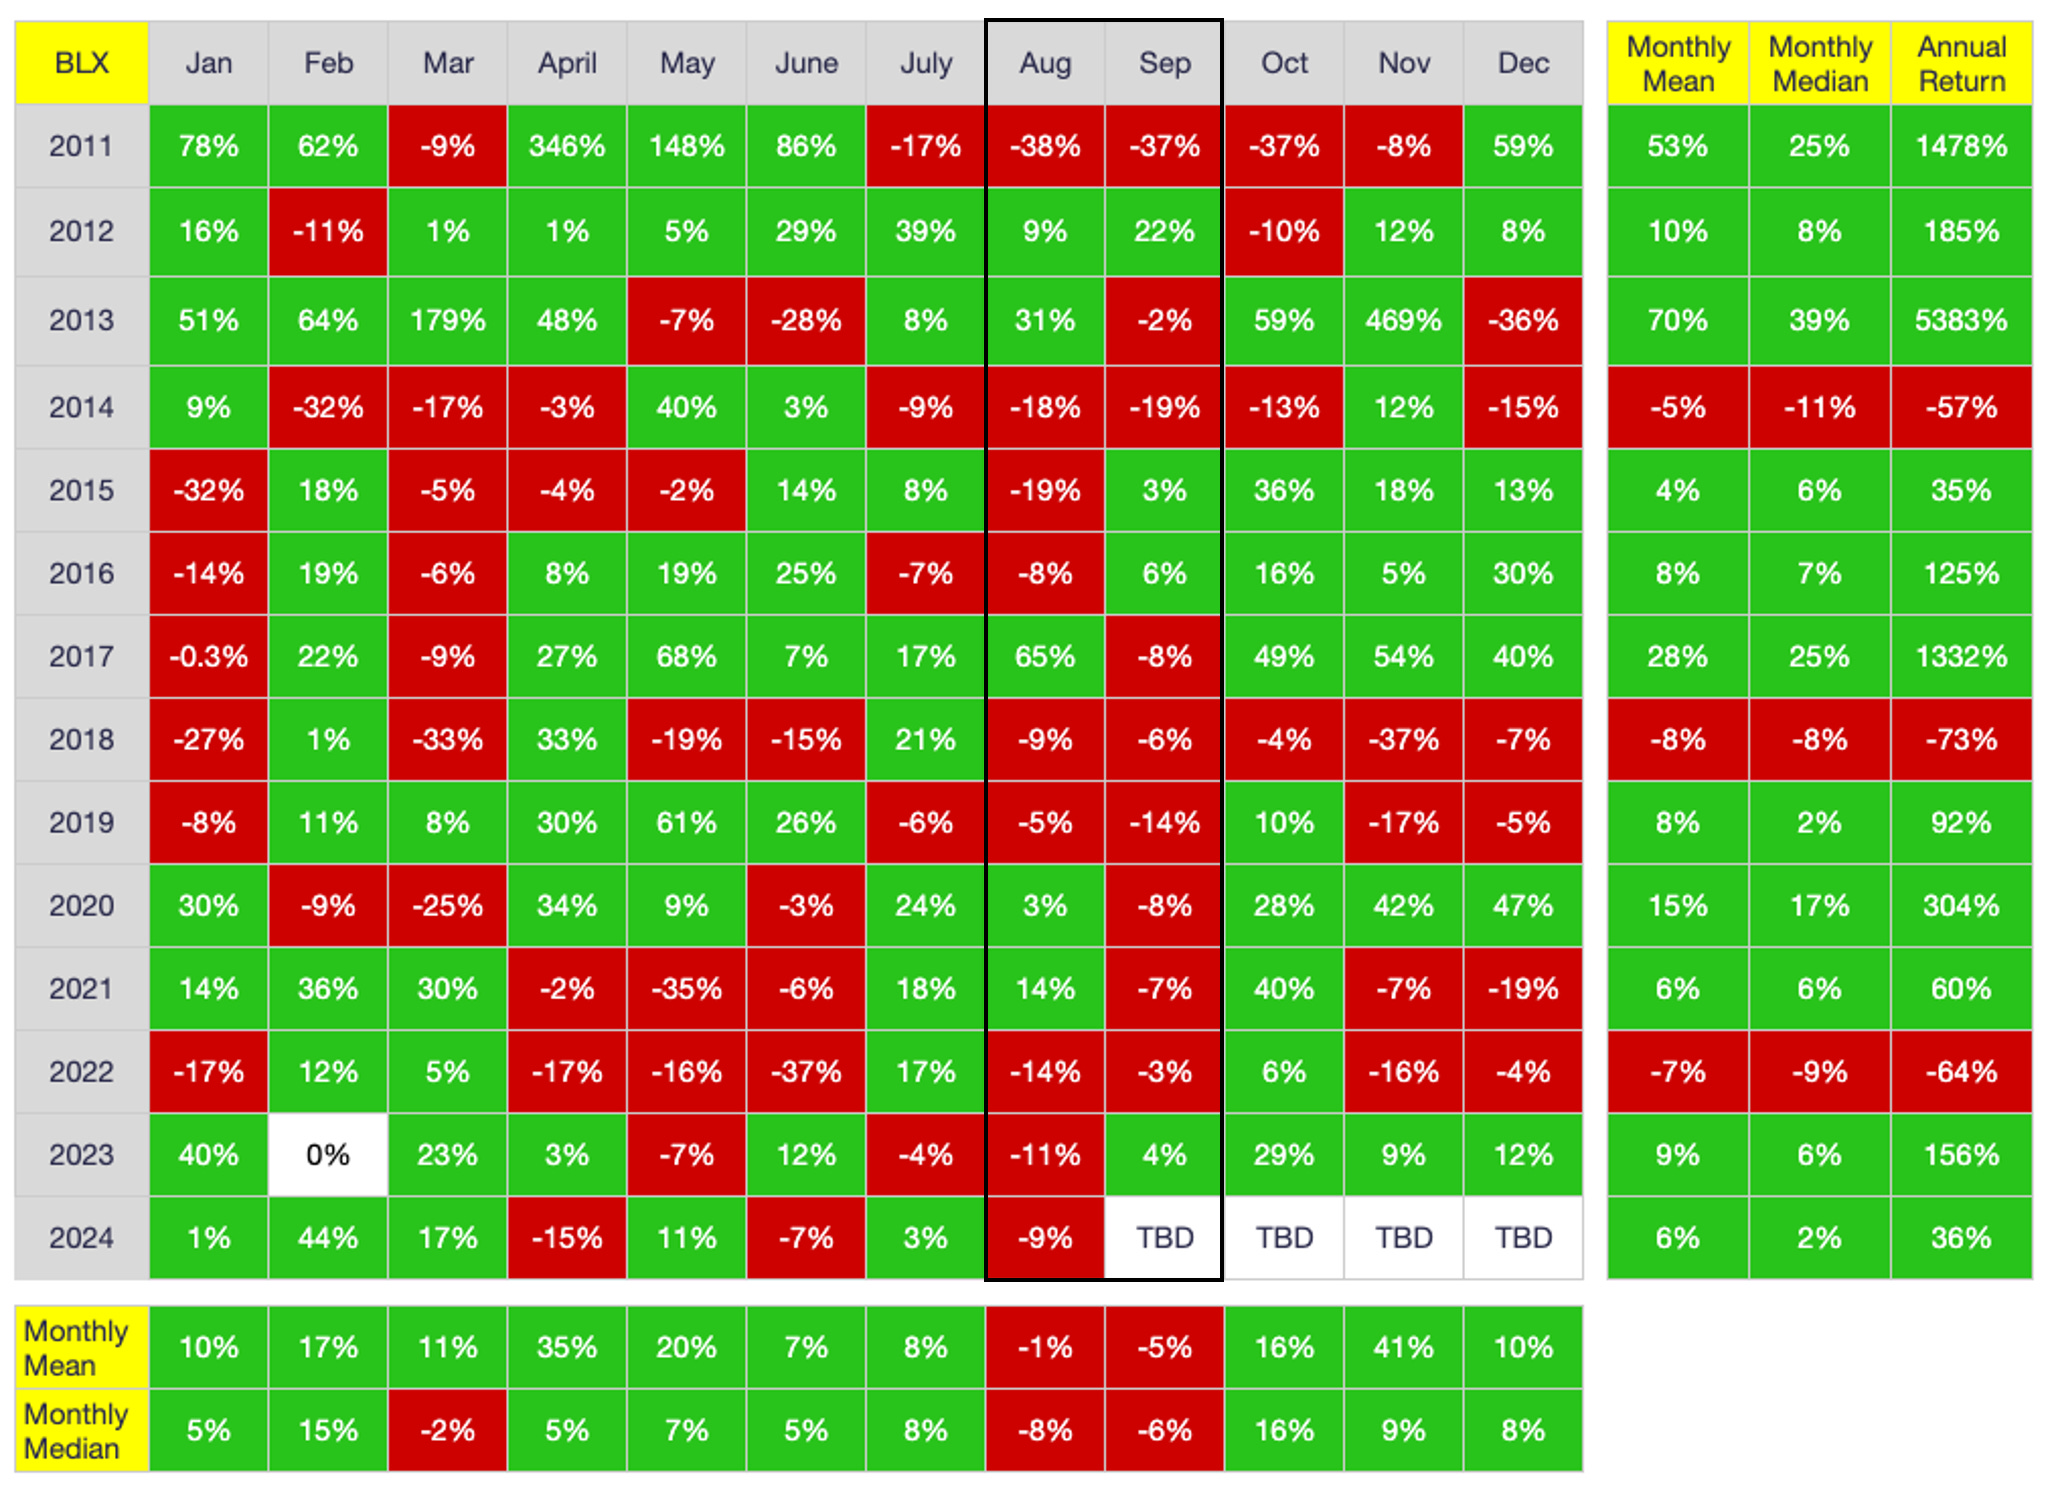
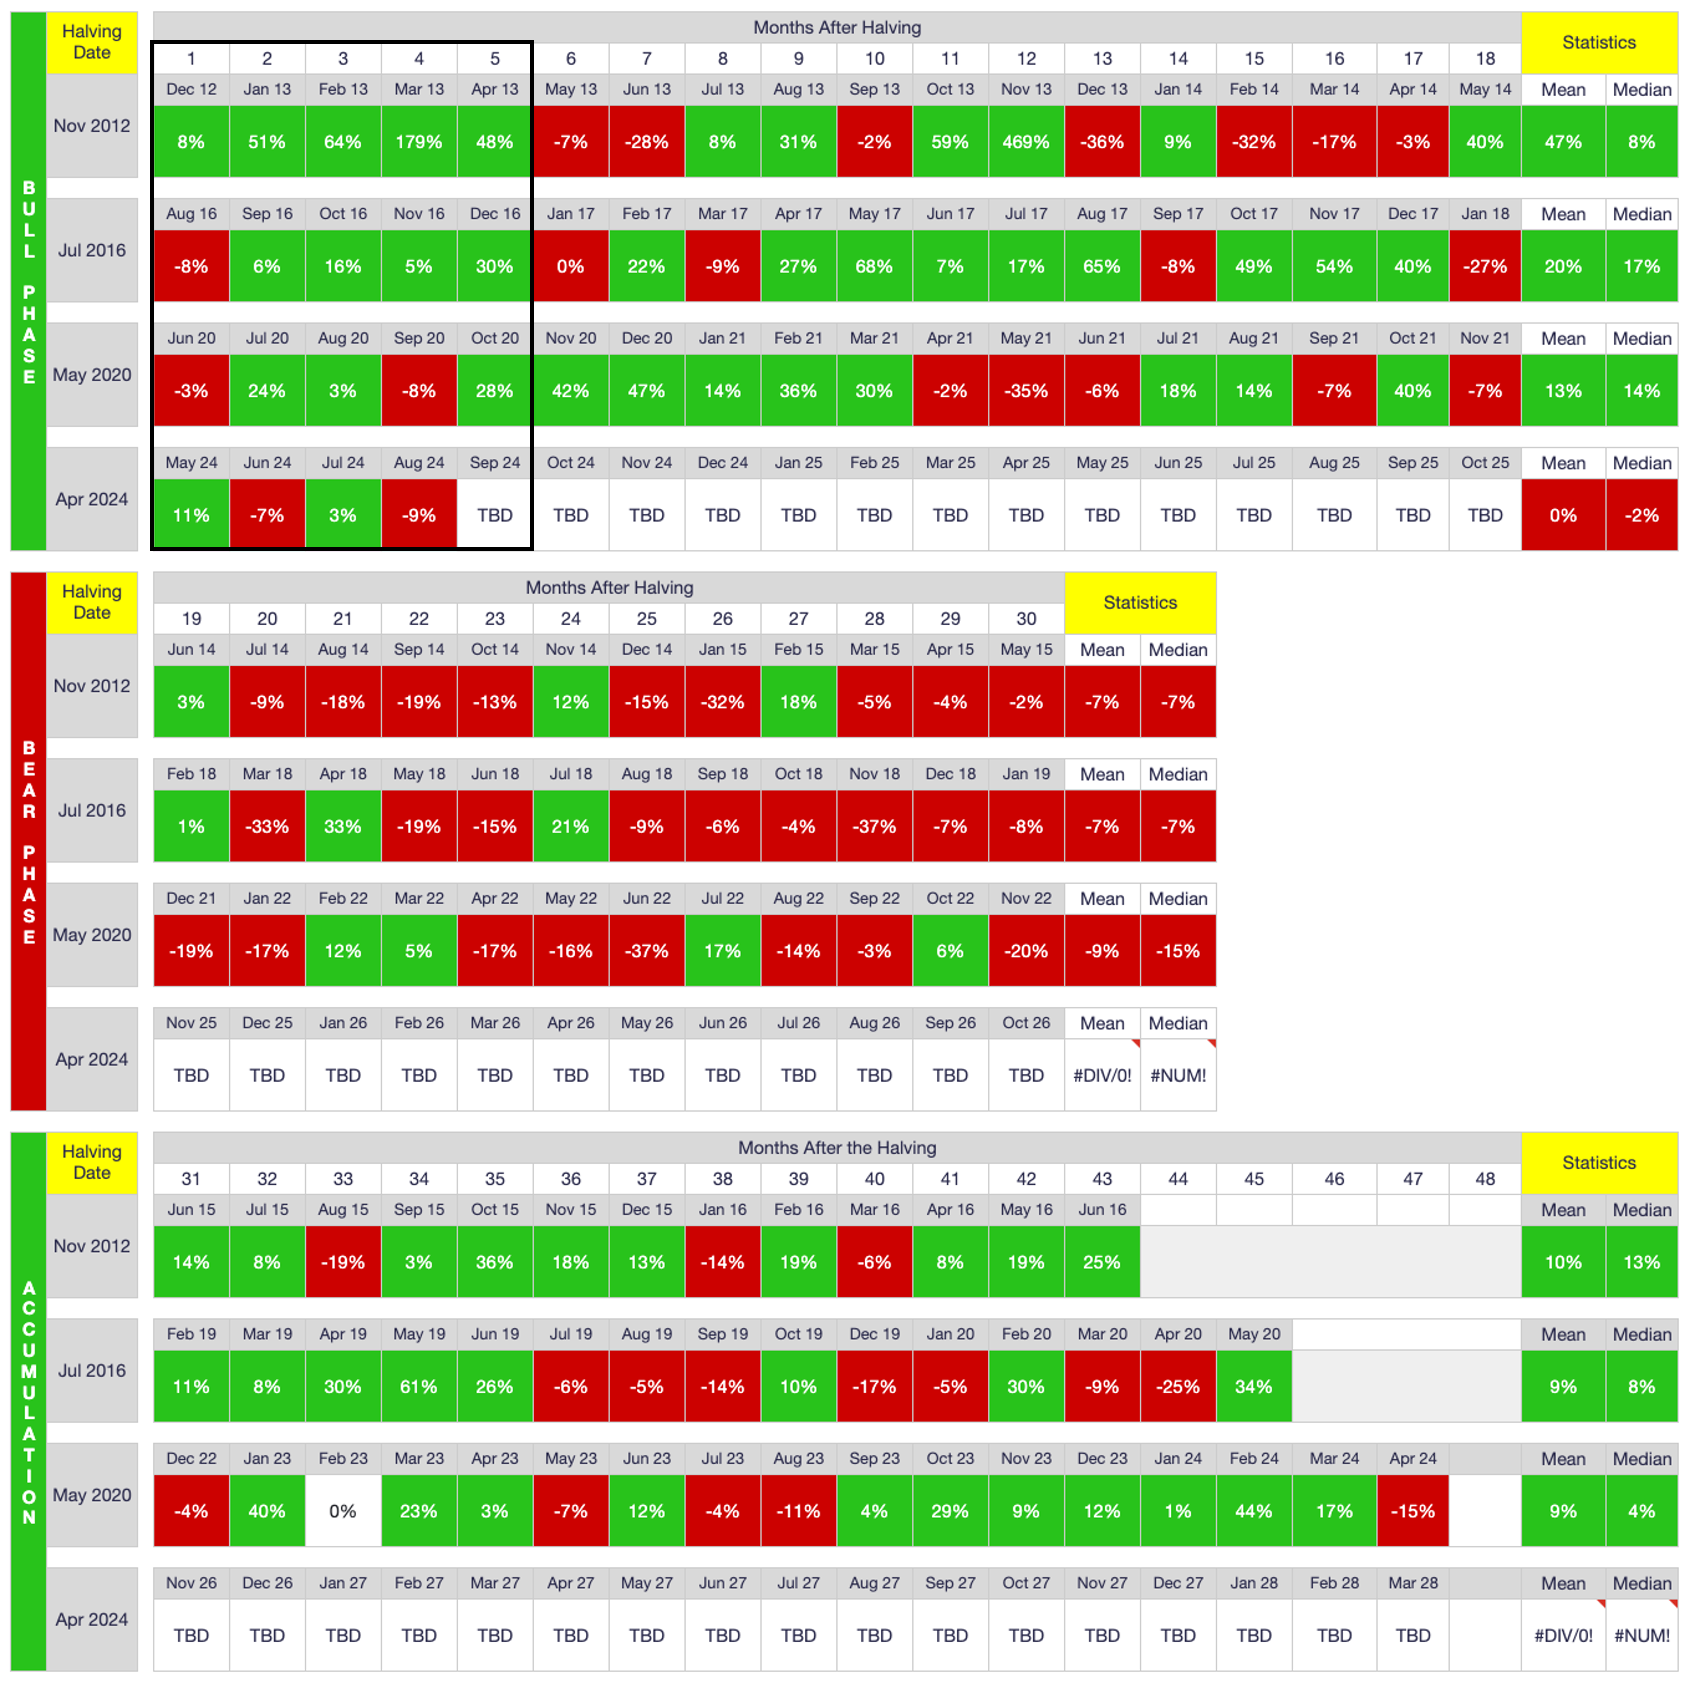
While September is a notoriously bad month for BTC (and most other markets for that matter), there are two reasons I am optimistic that September 2024 will actually close higher. First, as shown in the calendar-month table above, August and September countertrade each other more often than not, meaning it is less common both months close either higher or lower. For example, the last time both months closed lower was 2022, which of course was during one of the worst bear markets in BTC history. And if you look at last year, BTC actually closed higher in September (+4%) after closing lower in August (-11%). Moreover, as shown in the halving-cycle table above, there has never been two consecutive down months within the first six months of a halving. Granted, there have been only three halvings prior to the current one, but there is no disputing that new halving cycles are generally more bullish than bearish early in the cycle. For these two reasons, we bulls have every reason to be optimistic during September despite the month’s infamous reputation as a portfolio killer.
On-Chain Data
Below are the distribution of BTC addresses and coins the past 12 months:
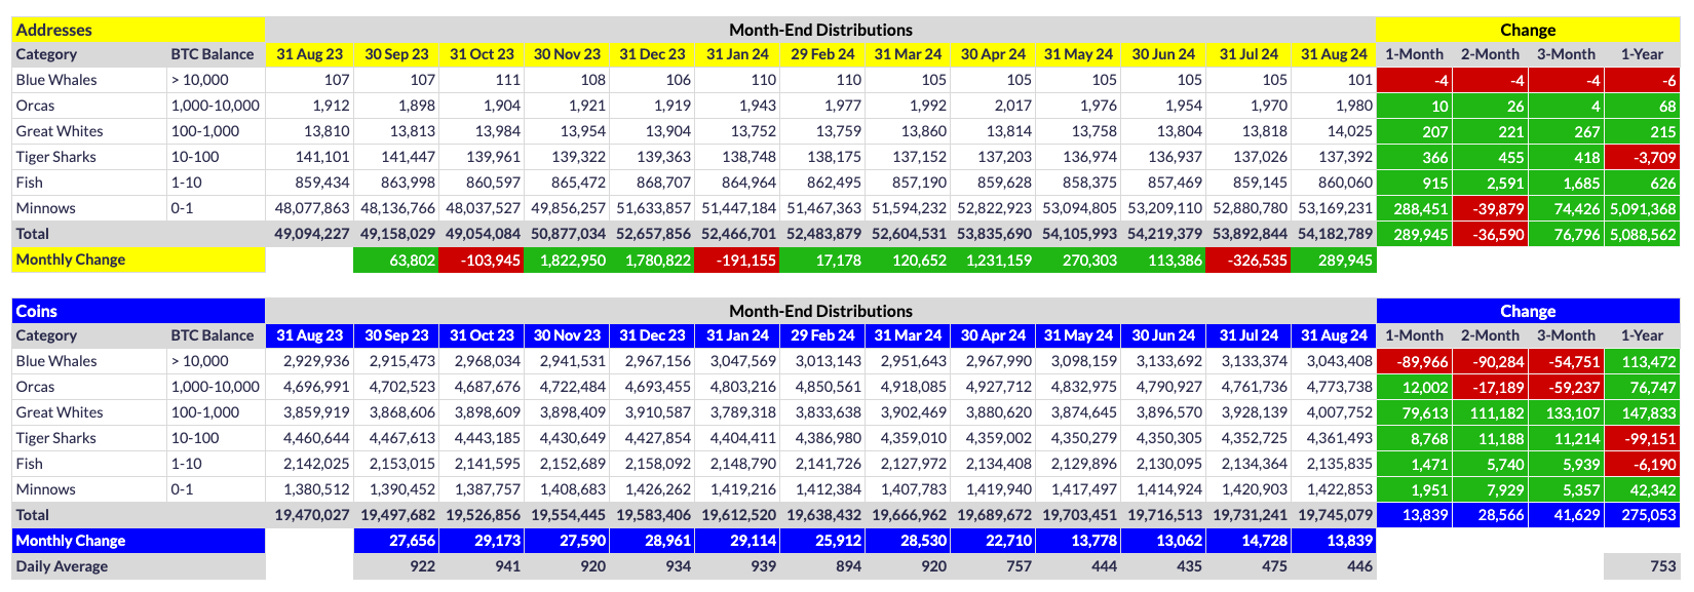
The obvious standout above is the loss of four Blue Whales (BW) in August. Their count had been flat for five months prior to August, hovering at 105, but that floor finally caved this past month. Fortunately, a net six Orcas evolved to soak up some of the BW selling, but obviously nowhere near enough, which is why price capitulated.
As I say virtually every month, we will not see substantial and sustainable price gains until Orca counts start increasing exponentially, so at least their trend is moving in the right direction. i.e., At these price levels, Orca-sized purchases are necessary to move the market, which is why I pay so close attention to Orca counts in particular. That said, we bulls need BW counts to remain stable as well or the selling pressure will simply be too much to overcome.
Below are exchange-inventory changes for the past 12 months:
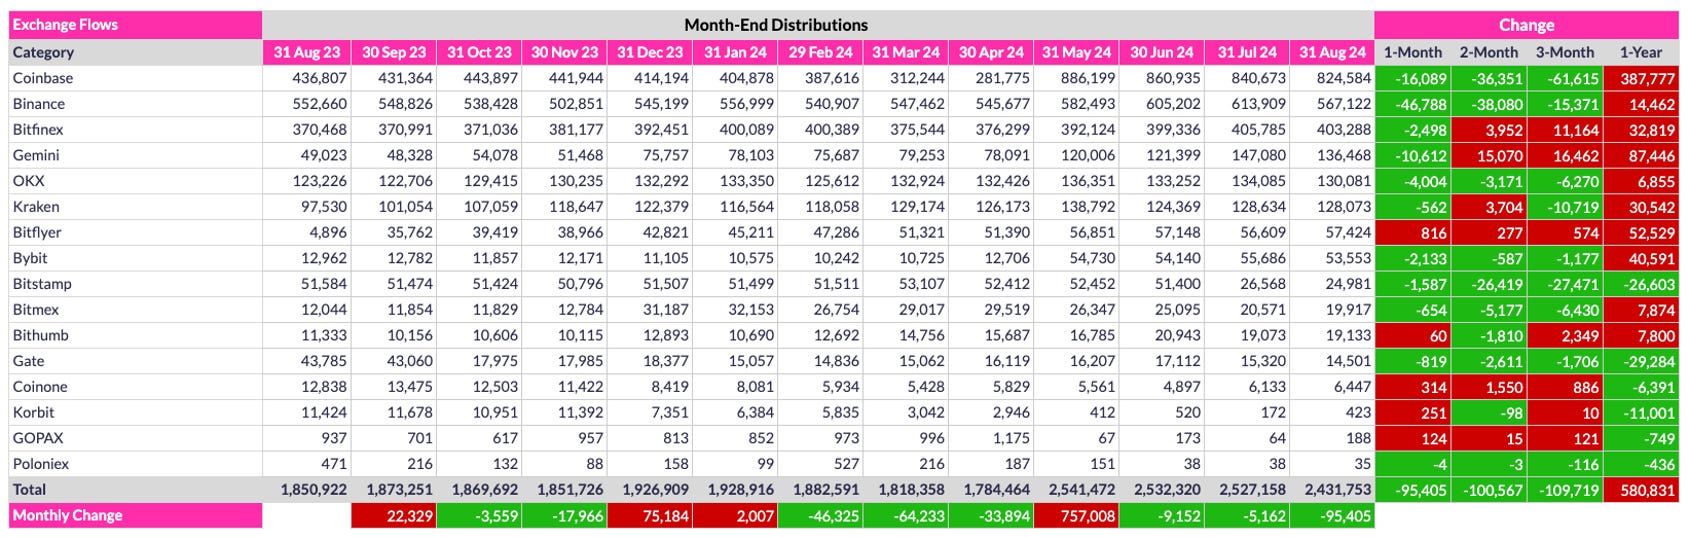
As I have mentioned for a few months now, the 1-year changes above are largely irrelevant due to Coinglass doing a wallet scrub in May of this year. At that time, they identified a number of new exchange wallets, so virtually all exchanges suddenly appeared to have many more coins than they had the previous day. That said, more than three months have passed since the scrub, so the 1-month, 2-month and 3-month data above are relevant. To that end, a huge chunk of coins left exchanges in August, which is perhaps the single most bullish data point from this past month. i.e., Some very large purchases were made in August and pulled off exchanges (primarily Coinbase, Binance and Gemini) despite the generally bearish PA. While such outflows rarely have an immediate impact on price, they will have a huge impact eventually. i.e., We are still a few years away from the mother of all supply shocks, but it is definitely coming for those patient enough to wait for it.
US Exchange Traded Funds (ETFs)
Below are the changes in share-count for the approved US spot-BTC ETFs since their launch in January 2024:
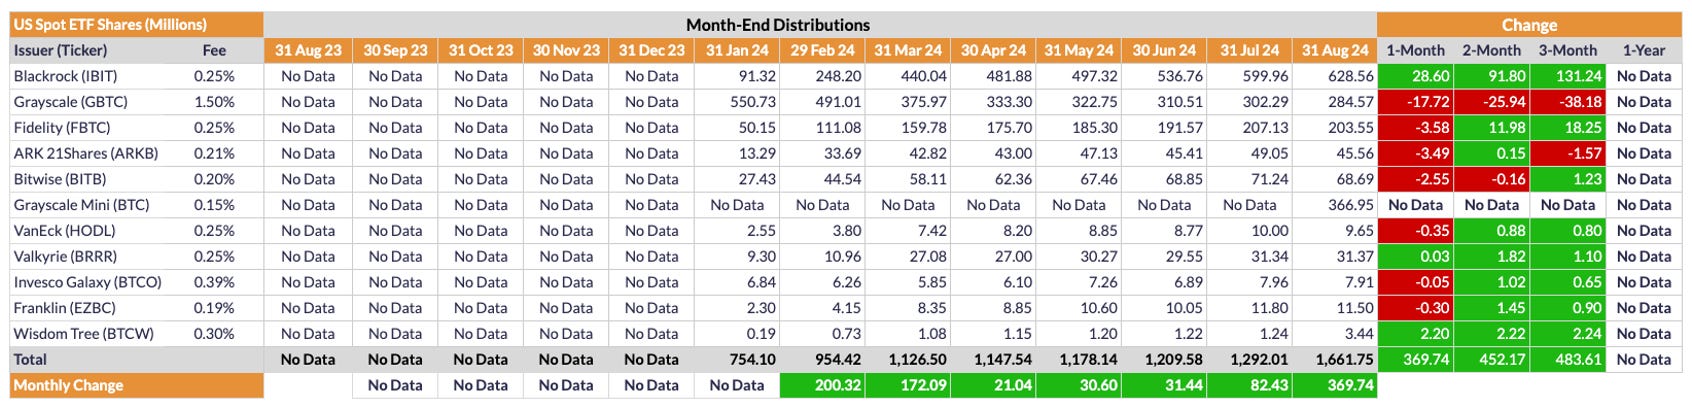
At first blush, it appears US ETFs had a massive expansion in August, adding 369.74M shares, but this isn’t exactly the case. As shown, Grayscale’s Mini BTC ETF launched in August, which has added 366.95M shares to the overall ETF count. After taking this launch into account, all other ETFs combined were more or less flat for the month (369.74M - 366.95M = 2.79M new shares). In this sense, August is the smallest US ETF expansion to date, which of course helps explain the generally bearish PA in August.
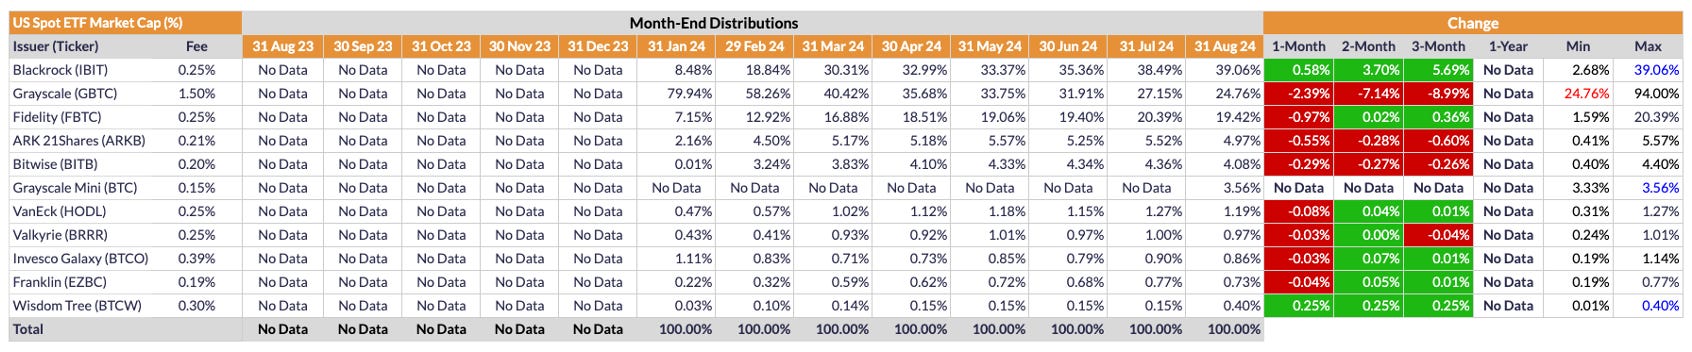
From a market-share perspective, Blackrock (IBIT) continues to expand its dominance as shown above, now controlling just over 39% of the total US ETF market, its highest percentage to date. Conversely, GBTC continues bleeding out, reaching a new nadir of less than 25% market share, though Grayscale has finally tried to counteract such bleeding by launching its so-called Mini BTC ETF (BTC), which is already the six largest ETF by market share (at 3.56%).
Conclusion
As I postulated late last year, it was possible some of the gains that typically follow a halving were pulled forward due to the anticipation and launch of US ETFs. That postulation now appears correct. i.e., While I still expect an epic bull run to commence later this year, I do think price got a bit ahead of itself earlier this year due to the anticipation and launch of US ETFs. We are now suffering the hangover of such euphoria. That said, I wouldn’t characterize current PA as bearish per se. It’s more lethargic than bearish; there simply is a lack of interest in the corn right now, primarily because the macroeconomy is (suspiciously/head-scratchingly) quiet. i.e., During the FTX collapse (among other problems) a few years ago, the market was obviously bearish, with some wondering whether it would even survive. That circumstance is very different from now, where the primary problem is a general lack of interest. Spot volume has been down for months, which is completely different from the bear market of 20222. i.e., With everything quiet (for now) in macro land, very few new people see the need to invest in Bitcoin. In a perverse way, Bitcoin thrives during periods of chaos as opposed to periods of calm. That’s why price is fading now. Remarkably (if inexplicably), macro markets are quiet. Inflation is coming under control, the US is showing some signs of economic weakness but not recession (yet), etc. But the current period of calm will not last. It never does. And when chaos returns, #BTC, for better or worse, will shine.
Go #BTC.
Great analysis as always David. Thanks!