Month-End Analysis
December 2024

Disclaimer
The data I use (BitInfoCharts, Coinglass, CoinMarketCap) to compile the tables and graphs contained in the on-chain section of this analysis do not always align with data found via others sources like Glassnode and CryptoQuant. I cannot explain the reason for the differences nor can I confirm which sources are most accurate. For this and other reasons, I have come to trust only the on-chain data I collect when trying to explain and/or predict Bitcoin’s (BTC) future price action (PA). Whether you too find my on-chain analysis useful is for you to decide, but I can assure you that some of my observations and/or predictions will differ, often markedly, from other observations and/or predictions you will see on Crypto Twitter (CT) and elsewhere.
Price Action
December PA was no doubt a letdown to many, with (largely baseless) predictions of a so-called Christmas/Santa rally failing to materialize, or at least sustain. After opening the month at $96,462 (on BLX), price did indeed break through $100K on its way to a peak of $108,270 (on Dec 17) before spending the rest of the month careening. When all was said and done, price closed 3.92% lower at $92,679. Despite the disappointing latter half of the month, 2024 in aggregate closed an incredible 119% higher than 2023, which is a great year by any standard, even Bitcoin’s:
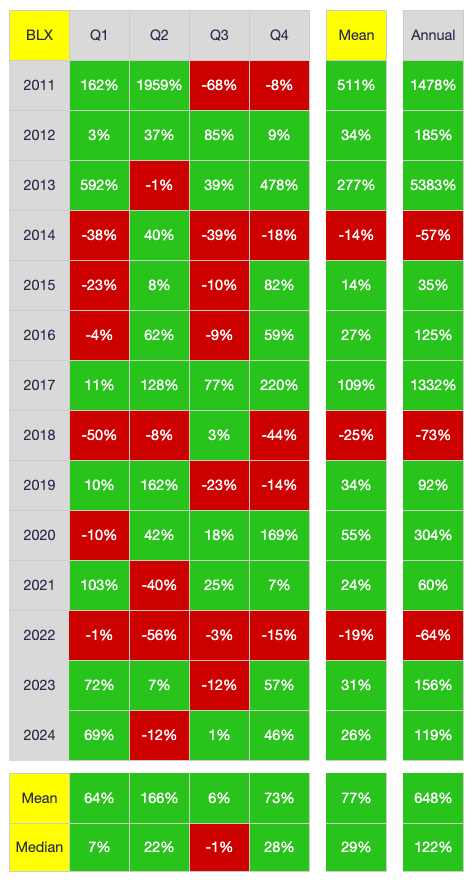
As shown above, 2024’s 119% return is nearly exactly the median annual return for BTC over its existence (122%), finishing higher than six other years in its 14-year history. Moreover, it is the first time since 2016-2017 that BTC has more than doubled its price (> 100% return) two consecutive years.
That said, let me try to disabuse everyone forever more of the notion that December is a bullish month for BTC. It is not, full stop:
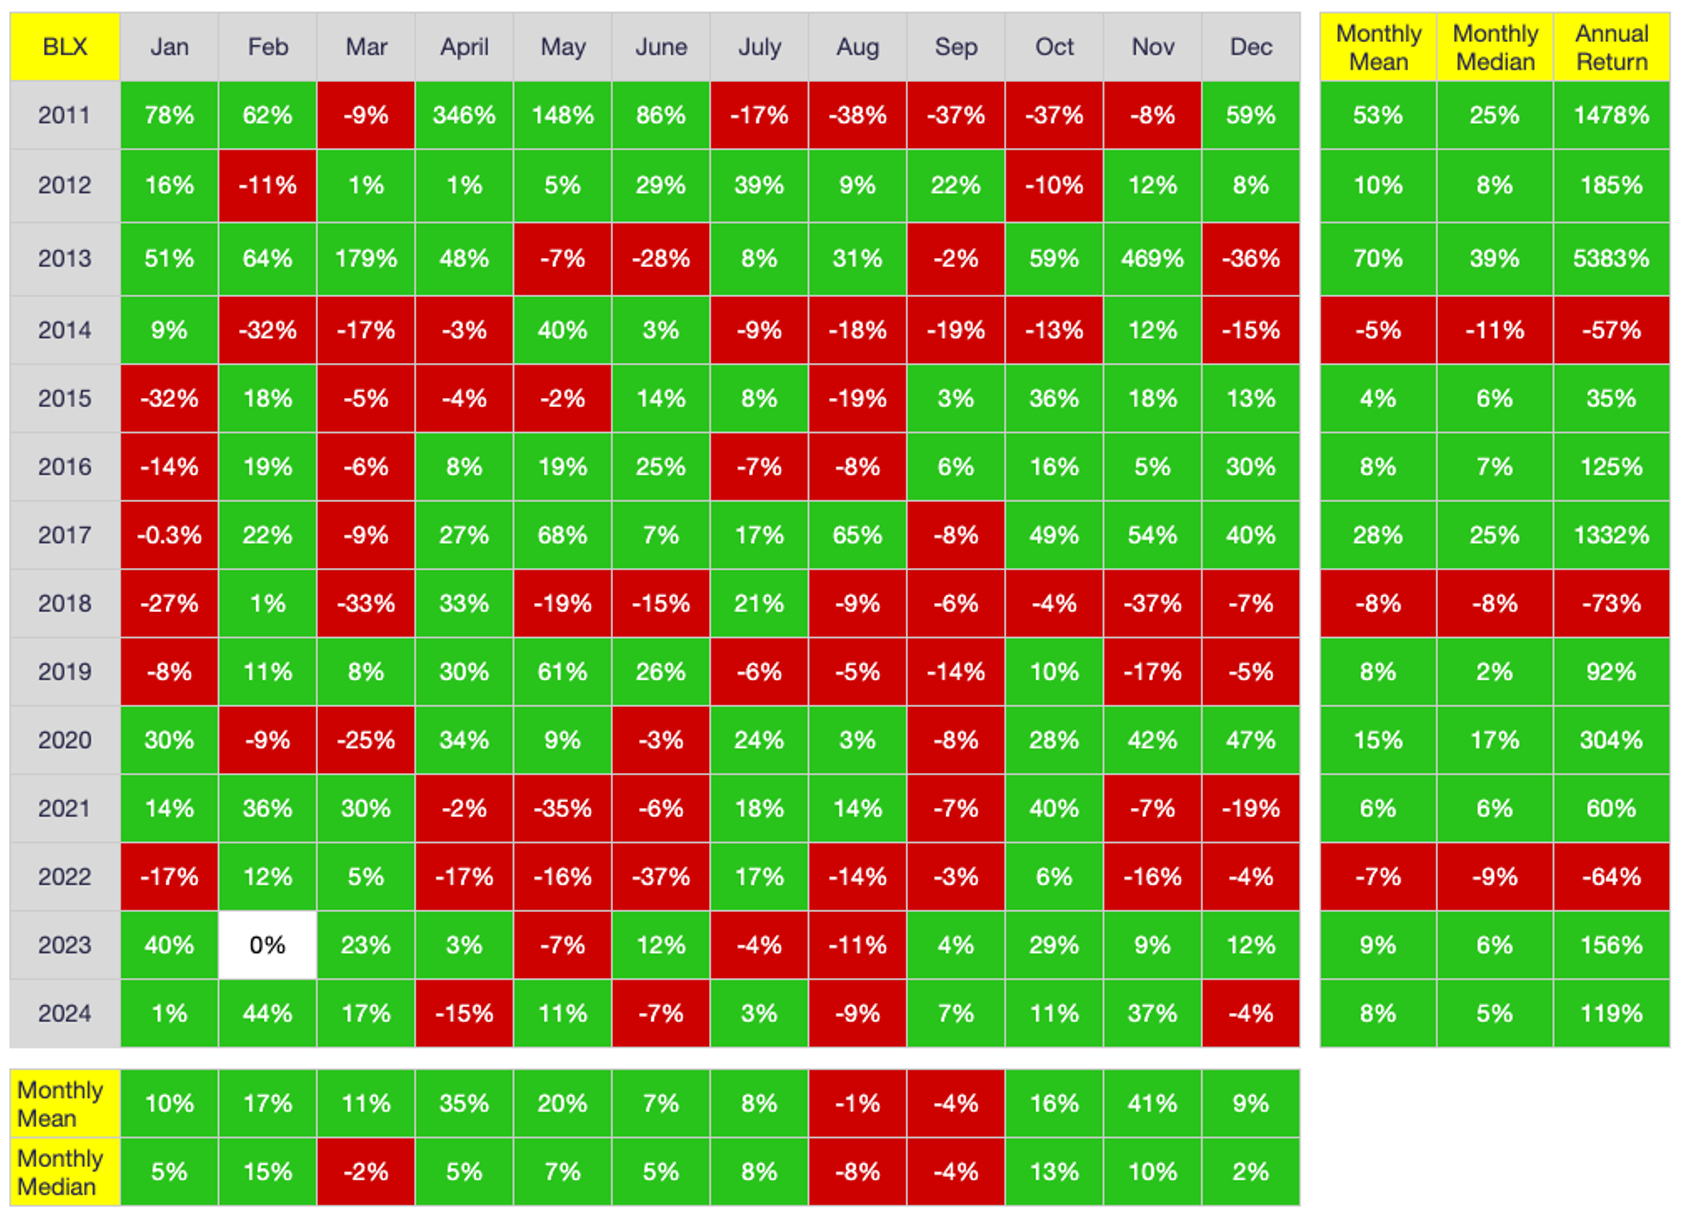
As shown above, December is a literal coin-flip, having closed lower the same number of years it has closed higher (7). Even more starkly, December has closed higher only twice in the past seven years, so if there is a trend at all, it is that December is more likely to close lower than higher. And in many respects, this makes sense: institutional traders have been more involved in the market for the past several years, and many of these same traders close out their books each year in December, whether to lock in profits or losses, rebalance their portfolios or merely close out positions before the holiday season. Whatever the reason, December is not a bullish month for BTC. Please keep that in mind next year and beyond when you hear all the chatter about an impending Christmas/Santa rally.
All that said, I too anticipated December would close at least a bit higher given where the month fell in the halving-cycle calendar:

As shown above, December is the eighth month following the most-recent halving, falling squarely in the middle of the bullish phase of the halving cycle. It is for this reason I expected PA to close higher in December. In fact, I predicted last month that price would pierce $100K though ultimately close below $100K:
What is more likely to happen, IMO, is that price makes another run at $100K, briefly breaks through but fails to hold, and then closes the month just below $100K. i.e., December will print green, but only by a bit.
As shown, I came very close to nailing December PA. Obviously price closed a bit lower rather than higher, but I wasn’t far off in my PA forecast. In fact, I also postulated the alternate scenario below:
That said, make no mistake: December returns are not as universally bullish as many seem to believe. If you look at the calendar-returns table I posted above, December has printed green “only” seven of 13 times in BTC’s history. Moreover, we have now had three consecutive up months, so a dip in December would hardly be unprecedented, particularly with the $100K ceiling looming so large just above current price. e.g., Market bulls could make another run at $100K in December, fail again, then get a proper market capitulation in response, pushing price back down to $90K, $80K, or even lower. While I am not predicting this scenario, it is certainly plausible yet would in no way jeopardize the current bull phase of the halving cycle.
The latter statement in the excerpt above is perhaps the most important: the fact that December closed lower in no way jeopardizes the overall structural bull market we are in. In this respect, predictions stating that the cycle top is in at $108K are utterly baseless. BTC’s halving cycles seem to follow a nearly programmed rhythm of ebbs and flows, a rhythm that has yet to break in BTC’s 14-year history. i.e., There is no reason to question the rhythm now, at least until/unless it breaks.
For this reason, and particularly because December closed lower, I am very confident January 2025 will close higher, particularly given that President-elect Trump will take office on January 20. I think the hype surrounding his inauguration alone will push price higher, but equally importantly, it is rare (if not unprecedented) for BTC to have consecutive down months this early following a halving.
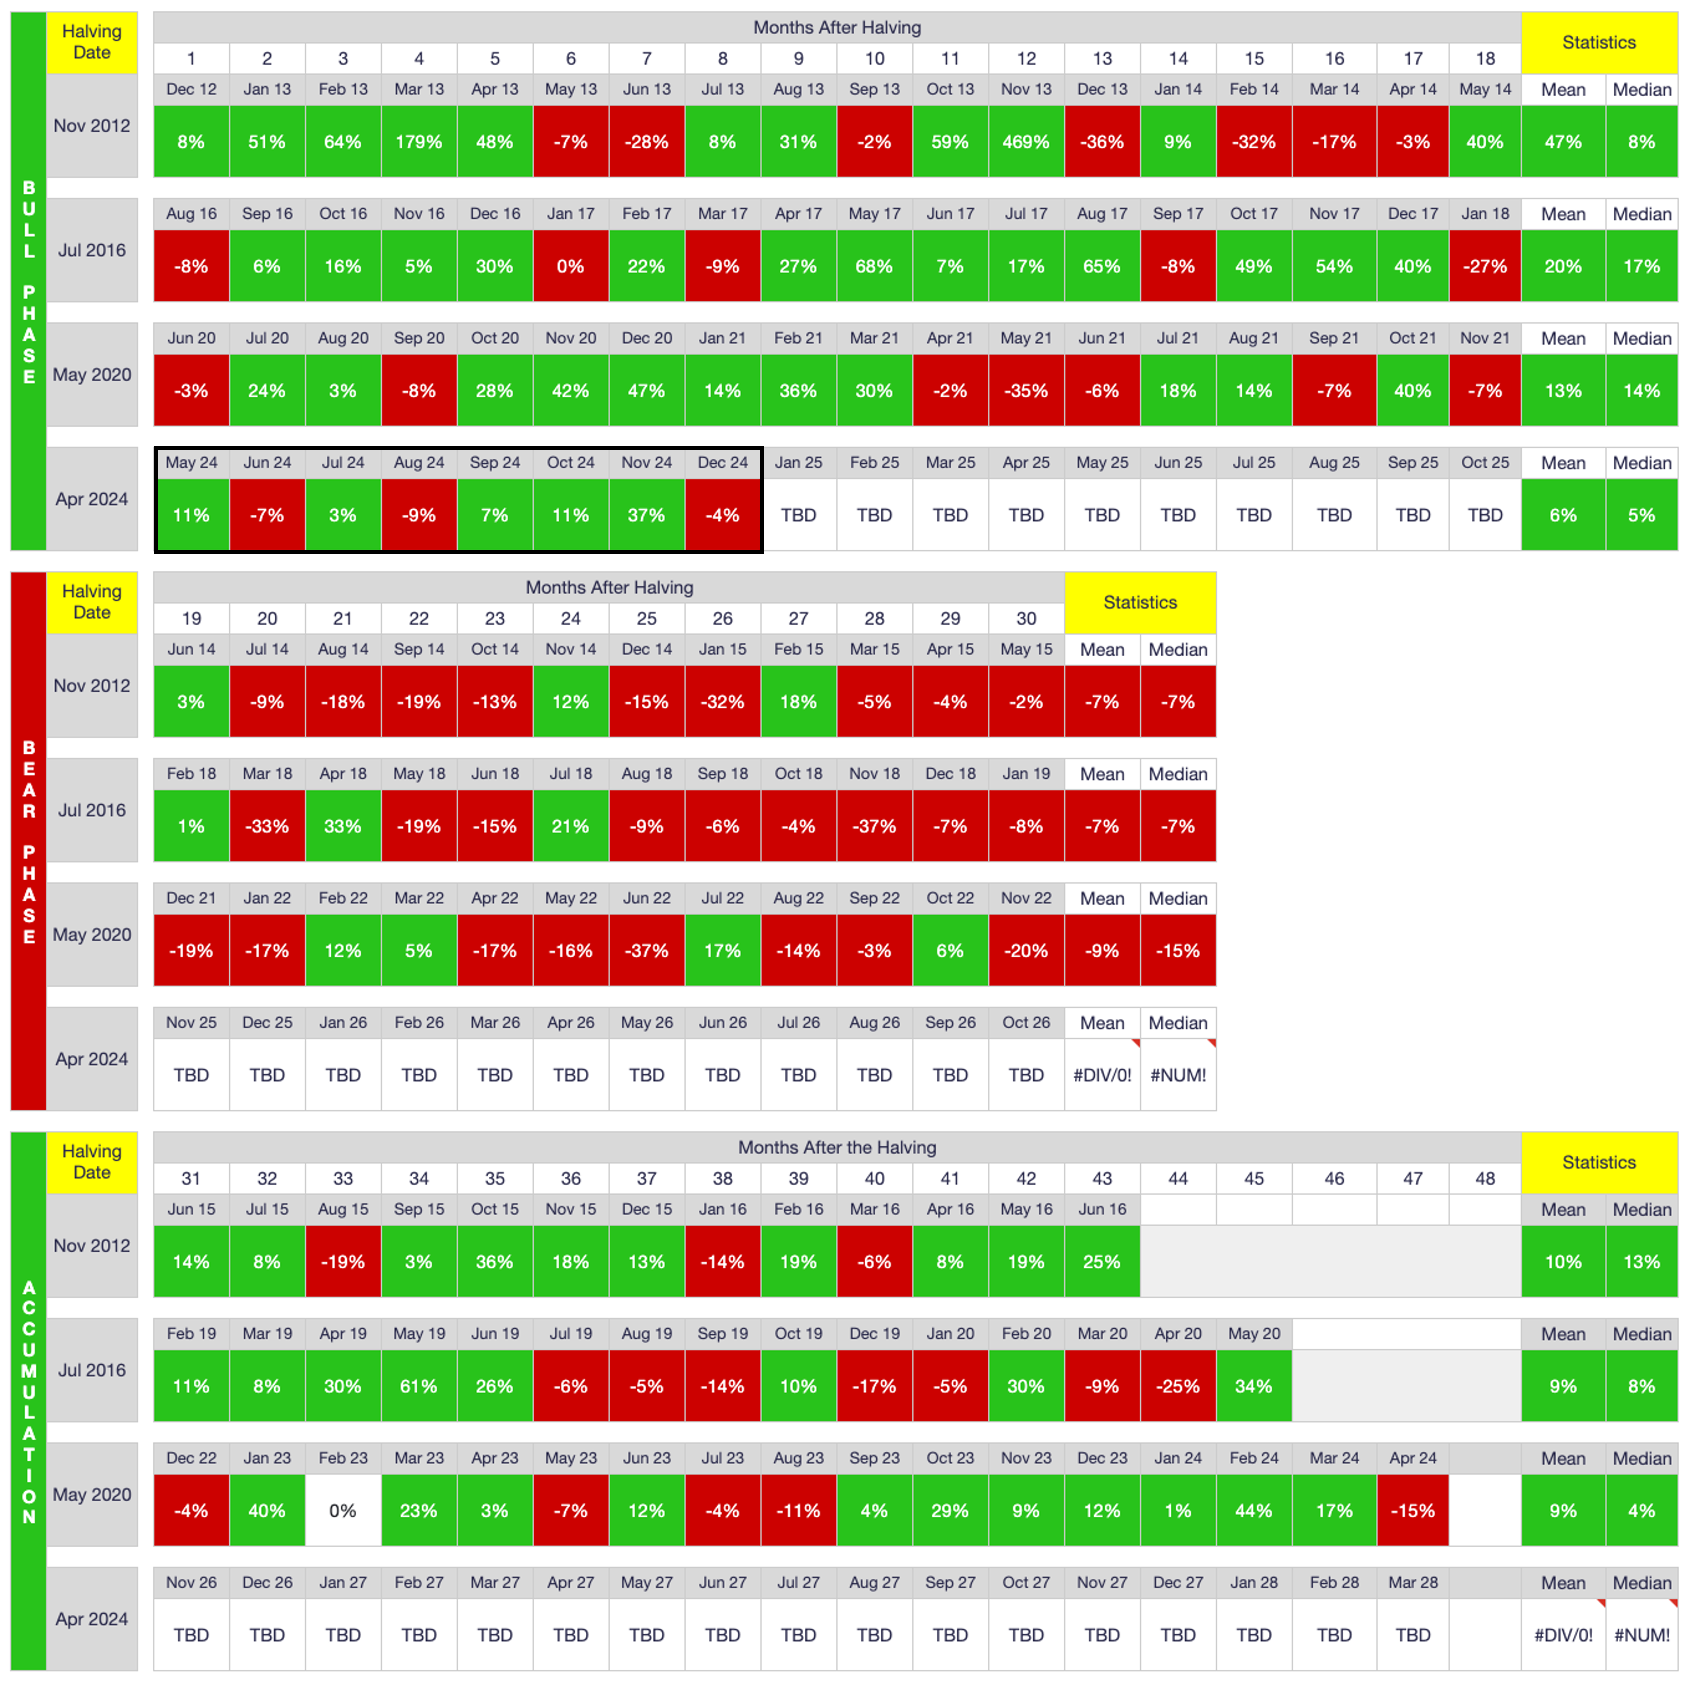
Looking at the halving-cycle calendar once again, the last time there were consecutive down months this early in a halving cycle was May-June 2013. As such, I will be genuinely surprised if price does not close higher in January, quite possibly above $100K, and perhaps even well above $100K if markets get especially frothy with the US regime change.
All that said, I would be remiss to not at least present the bear case, that being the fact that the current pullback is still only 16% peak to trough, which is NOTHING in Bitcoinistan. As I pointed out last month, the epic bull market of 2016-2017 had SIX contractions between 27% and 47% on its way to a near-2400% gain over 15 months. In this sense, we may be only halfway through the current pullback, with price potentially dropping down to +/- $75K (~30% pullback) before stabilizing and beginning a new ascent. Moreover, consecutive down months in the bull phase of the cycle, while rare, are not unprecedented. Again, it happened May-June 2013, and there were even three consecutive down months April-June 2021, though this latter pullback occurred later in the cycle and after a six-month run of up months.
Nevertheless, while anything is possible, I do believe we will see higher prices in January, and likely for most of Q1 2025, before PA finally takes a breather to consolidate. Could I be wrong? Of course. But my track record has been pretty good to date, and my confidence is high for January.
Great. I have all but assured a lower price now, LOL.
On-Chain Data
Below are the distributions of BTC addresses and coins the previous 12 months:
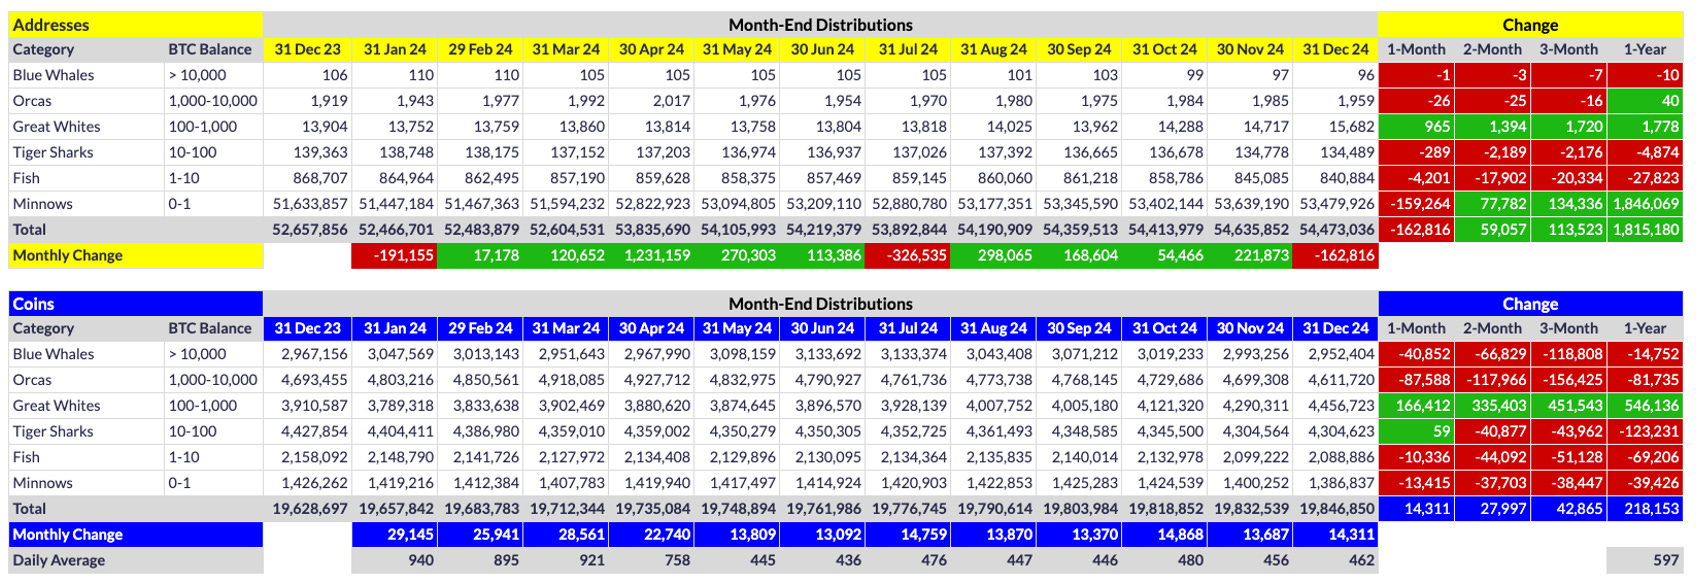
Anyone wondering why price dropped in December need look no further than the on-chain distributions above. My word, what a bloodbath. Contractions virtually everywhere in December, all with the exception of Great Whites (GWs), that is. Coins are all being sucked into the GW tier, and that has been the case for the past year. While I can only speculate, I think both Microstrategy (MSTR) and US spot-BTC ETFs (e.g., IBIT) have their coins custodied in GW-sized wallets.
I once again am faced with trying to decide whether this cycle’s GWs are last cycle’s Orcas. I am still somewhat reluctant to accept this possibility despite the impressive PA over the past year, not because of stubborness but because of the lack of clear correlation between GW counts and PA. Last cycle, when Orca counts started surging, so did price; when they contracted, price did too a short time later. That clear correlation (or, arguably, causation) is not present this cycle with GWs. PA goes both up and down even when GWs are on the rise. Part of this is the fact that whales are continually devolving, with 27 whales (1 Blue Whale and 26 Orcas) lost in December alone. i.e., Most whales don’t sell their entire stakes; they simply lock in profits, sometimes enough so that their wallets drop down to the GW tier. In this light, many of the GW “gains” this cycle are really just devolved whales. But that doesn’t explain the full GW expansion. Hence my thesis regarding how Coinbase custodies spot-ETF coins. I think these ETFs have their coins in GW-sized wallets, as does MSTR (although, again, that is only my speculation).
Whatever the reality, changes in GW count are not nearly as reliable in predicting subsequent PA as Orca-count changes were last cycle. There is definitely a pattern in the data, no matter how obscured; I simply haven’t unlocked it quite yet. But I will.
Below are the changes in exchange inventories over the past 12 months:
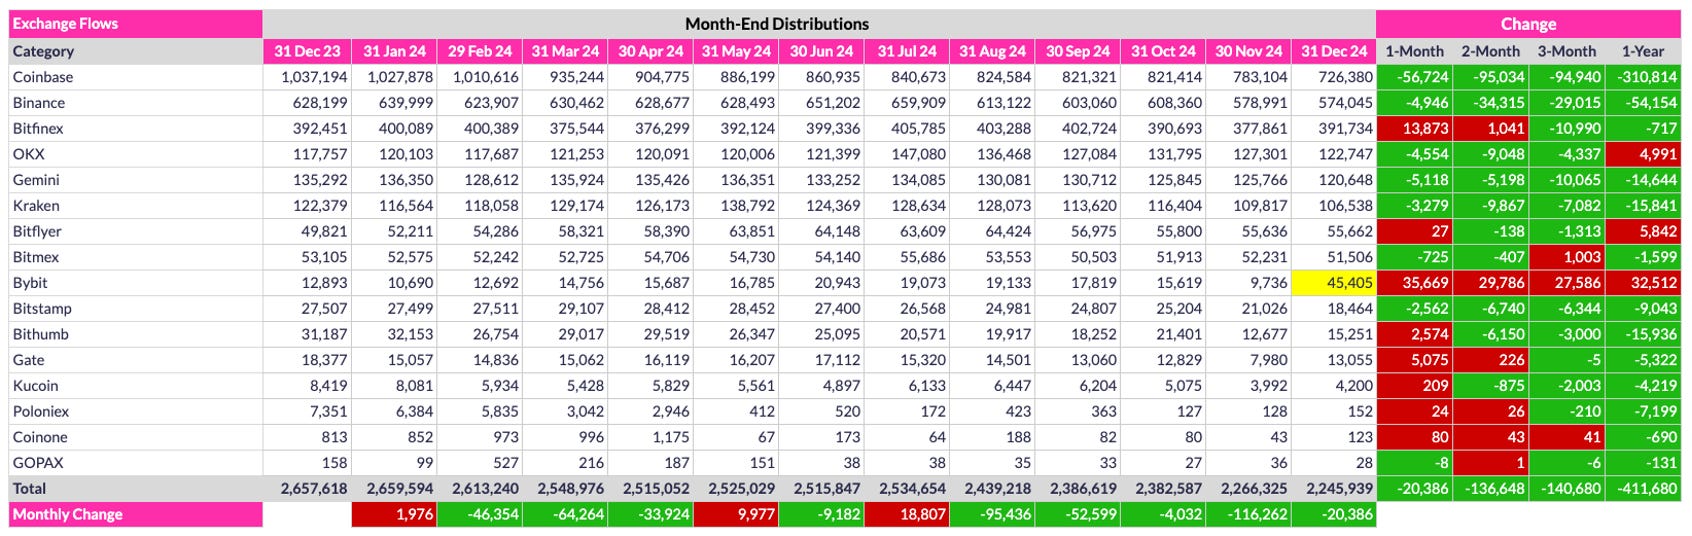
As shown, coins continue flying off exchanges, which is incredibly bullish for price over the long term. 20.4K coins came off exchanges in December alone, with a whopping 411.7K coins coming off exchanges in 2024. And that even includes the Bybit wallet scrub that Coinglass performed in December, which led to a sudden jump from 9.7K coins in November to 45.4K coins in December (i.e., This was not an inflow per se; just a new wallet identified as a Bybit wallet). Long and short, the long-rumored/awaited supply shock is coming. Never soon enough for folks, but it is absolutely coming.
US Spot-BTC ETFs
Below are the changes in share count of each US spot-BTC ETF since inception:
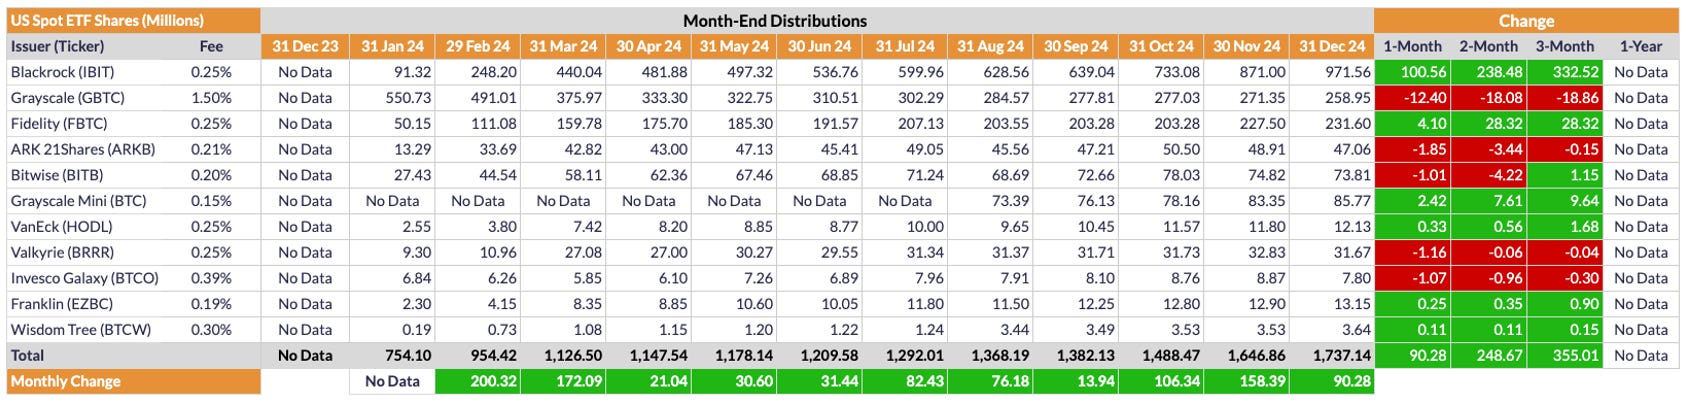
As shown, US spot-ETFs continue expanding unabated. It really is remarkable to watch unfold. Even with some late-month contraction, these ETFs still added a whopping 90.3M shares overall. That said, also as shown above, to the victor go the spoils, and the victor is clearly IBIT, Blackrock’s spot-BTC ETF. They alone added > 100M shares to their fund, meaning all other ETFs combined actually contracted a bit in December. It is no surprise, then, that Blackrock gained overall market share in December while all other ETFs lost ground:
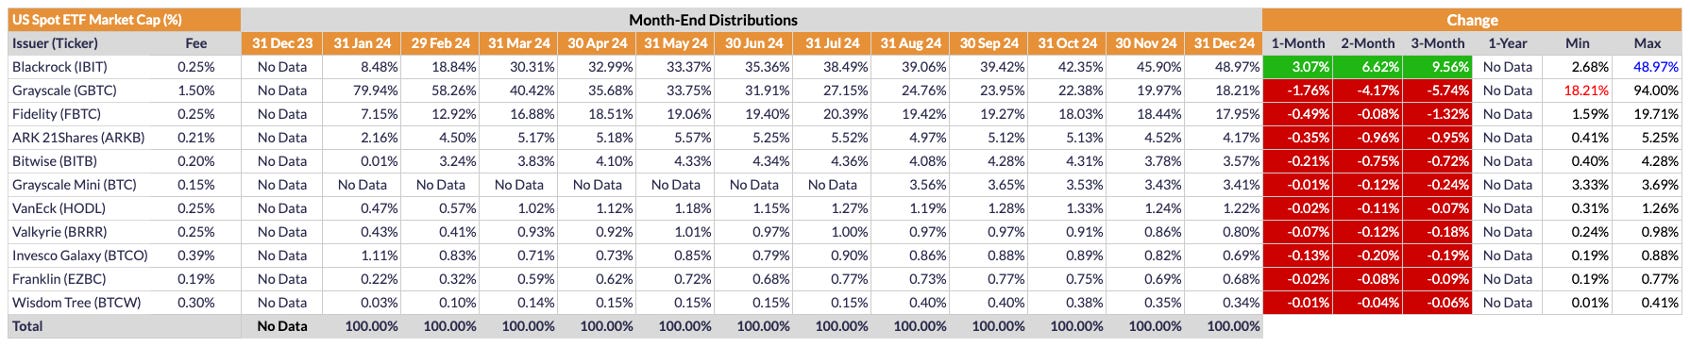
As shown, IBIT now controls 49% of the US spot-BTC ETF market, and it is likely to surpass 50% in January. Still, it is not all doom and gloom for non-IBIT ETFs:
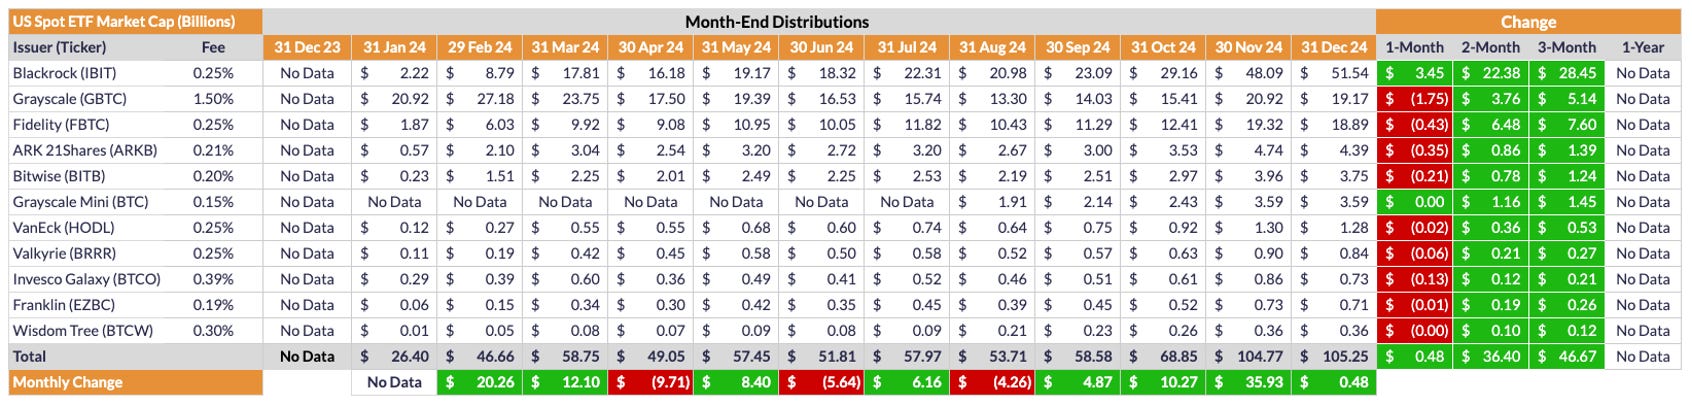
As shown above, even the smallest US spot-BTC ETF (BTCW) has a $360M market cap and seven of the 11 ETFs have a market cap in excess of $1.0B. Still, IBIT’s dominance is formidable. As shown, it is the only ETF to actually increase its market cap in December despite BTC’s 3.9% drawdown in price (NB: Grayscale’s Mini ETF had a microscopically small gain as well - hence the green-colored cell despite the number showing $0.00). Nevertheless, US spot-BTC ETFs in aggregate have a market cap of a dizzying $105.25B, by far the fastest growing ETF class in history.
Conclusion
December 2024 was not the month many had envisaged, particularly after price blasted through $100K and made it all the way to $108K by mid-December. For better or worse, MSTR’s relentless leveraged buying is likely what helped price reach these lofty heights in the first place, but the fact remains there are a number of whales who bought during the depths of the bear market who are now taking some chips off the table. Moreover, many institutional traders locked in profits, rebalanced their portfolios, etc., common Wall Street practices every December. i.e., Not all BTC buyers are maxis, and that is okay. If they were, there would be no one to sell to the flood of new people immigrating to Bitcoinistan each and every day. That said, with 2024 in the books, I do expect new positions to be opened in January, and that alone should bolster price. Add in Donald Trump’s crypto-friendly administration set to take office on January 20, and I think we bulls are in for a very good month. While we cannot ignore the fact that the current pullback is only half as deep as the garden-variety bull-market pullback, I personally am throwing my hat in the “green-month” ring. Not financial advice, of course. Just my opinion. Either way, as I pointed out in a tweet the other day, fiat inflation is OUT OF CONTROL, so we who are lucky enough to make/have more than we spend MUST invest in finite assets to protect our financial futures. While other finite assets exist (e.g., gold, real estate, art), none can compete with BTC as a store of value, a lesson more and more people are learning every day.
Happy new year, all.
Go #BTC.