Month-End Analysis
March 2024

Disclaimer
The data I use (BitInfoCharts, Coinglass, CoinMarketCap) to compile the tables and graphs contained in the on-chain section of this analysis do not always align with data found via others sources like Glassnode and CryptoQuant. I cannot explain the reason for the differences nor can I confirm which sources are most accurate. For this and other reasons, I have come to trust only the on-chain data I collect when trying to explain and/or predict Bitcoin’s (BTC) future price action (PA). Whether you too find my on-chain analysis useful is for you to decide, but I can assure you that some of my observations and/or predictions will differ, often markedly, from other observations and/or predictions you will see on Crypto Twitter (CT) and elsewhere.
Price Action
Yet another incredible month. BTC opened March at $61,179 (on Coinbase), peaked at $73,386 on March 14, a new all-time high (ATH), and then closed the month at $71,289, the first month ever to close above $70,000. All told, BTC ended the month 16.5% higher, marking the seventh consecutive month of higher closes. To put this streak into perspective, it is the longest win streak in BTC’s history, with the next longest streak being six months, from October 2020 through March 2021:
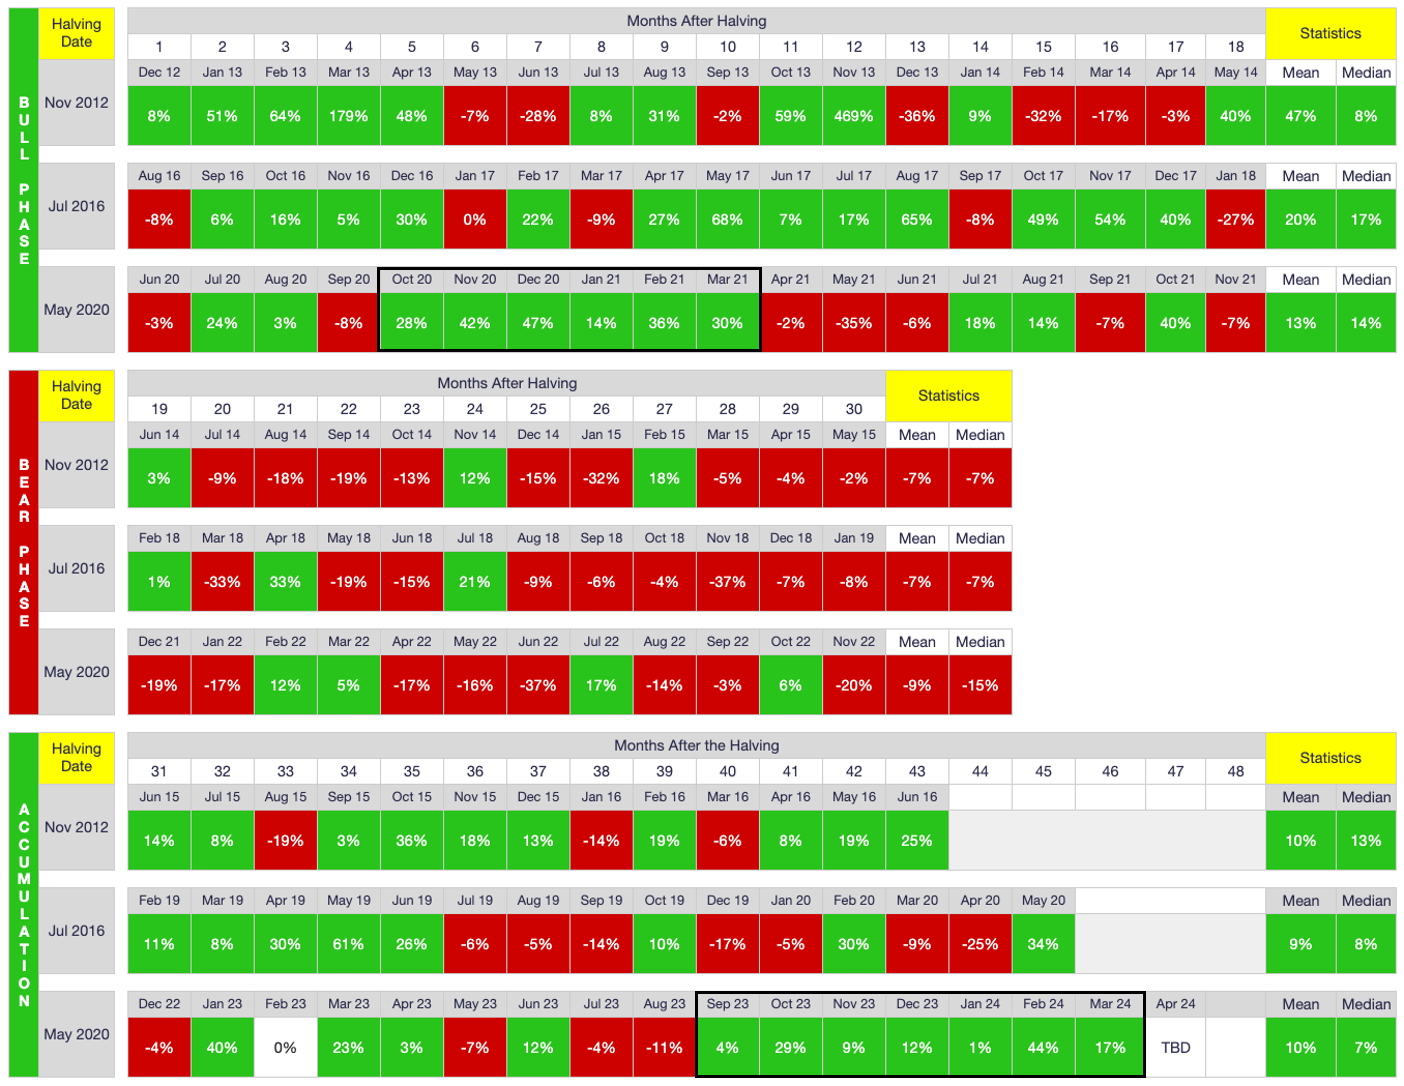
As shown above, there have been a handful of four- and five-month win streaks as well, but never before has there been a seven-month win streak. Until now, that is.
To say we BTC bulls have become spoiled is an understatement. When price swooned $10K peak-to-trough on March 5, temporarily breaching $60K ($59,245), my Twitter feed was rife with coping and bickering. The same is true when price pulled back for a week from the new ATH on March 14 to a low of $60,771 on March 21. This latter retracement totaled only 17% and price was still only $400 lower than where it had opened the month, yet negativity permeated CT. Ironically, some influencers have recently stated that the pullback we “endured” in March is the sizable correction the market needed, and now that it has occurred, price is free to resume its uptrend.
We’ll see. As many of you know, I too have been calling for a sizable correction:
So, does this mean a sizable correction is imminent? Imminent, yes. But soon? Who knows. As I tweeted back in December, there are only three potential outcomes given current PA:
1. A sizable correction is headed our way.
2. The next cycle will peak early (gains are being pulled forward).
3. We are in the early stages of a supercycle.
So, was the 17% mid-month pullback sizable, in my opinion? Heck no. It was a mere hiccup that lasted only a week! Need I remind anyone that price still closed the month 16.5% higher despite the mid-month 17% drop?
As many have pointed out for years, robust BTC bull markets regularly experience +/- 30% pullbacks on the way to new ATHs. So no, 17% is not sizable, especially considering the fact that it occurred in the midst of a SEVEN-MONTH win streak. I mean, look at the monthly chart for heaven’s sake:
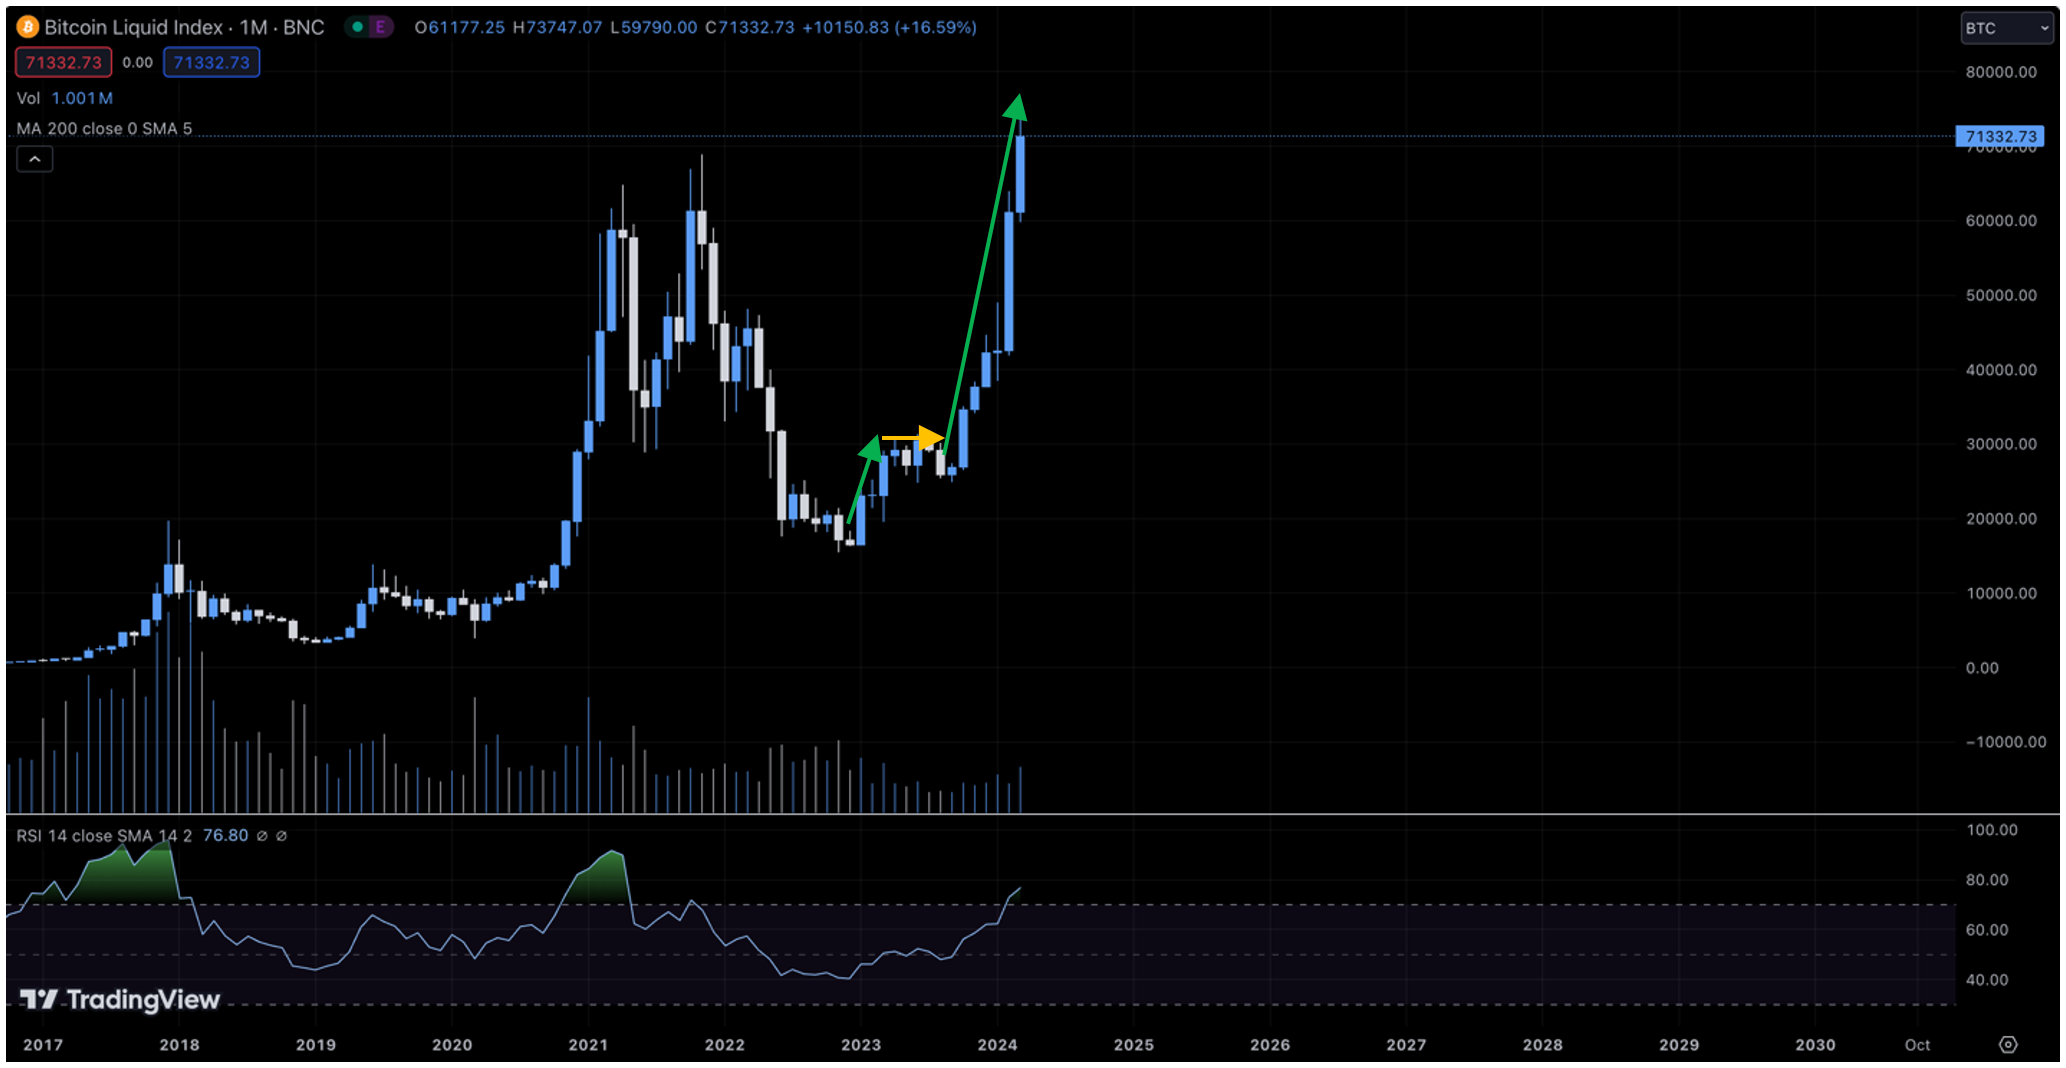
It has been nearly “up only” since January 2023 and literally up only since September 2023. We literally are in unprecedented territory in terms of BTC PA. While there certainly have been larger percentage gains throughout BTC’s history, there has literally never been such a sustained price increase. In fact, the current run has been so consistent, so sustained, that I am for the first time questioning whether this upcoming cycle really will be different from previous cycles.
In some respects, the upcoming cycle will undoubtedly be exactly like previous cycles. Price is - and will always be - a function of market sentiment. The upcoming cycle will thus see price reach both delirious highs and gut-punching lows along the way. However, what could differ this cycle is price reaching “escape velocity,” where it skyrockets to an order of magnitude higher before finding a new equilibrium.
Regardless, I am unwilling to entertain the “supercycle” hype just yet. And I won’t until at least June. i.e., I fully expect price to appreciate most of April as hype for the next halving peaks, but then I expect a “sell the news” mini-swoon shortly thereafter, simply because the impact of the halving does not instantly materialize. As previous cycles have demonstrated, the market needs time to absorb the effects of the supply shock even though the shock itself does indeed occur in an instant (currently projected to occur around 16:20 UTC on April 20).
Now, if price manages to eek out gains in both April and May, essentially extending the current win streak to nine months, then yes, even I will become a believer in the supercycle hype. But again, I am not there yet. I have been investing far too long to know that market sentiment can change on a dime and often does, especially when everyone seems to be sitting on one side of the sentiment boat.
Before leaving this section, below is a chart of BTC’s quarterly performance throughout its history:
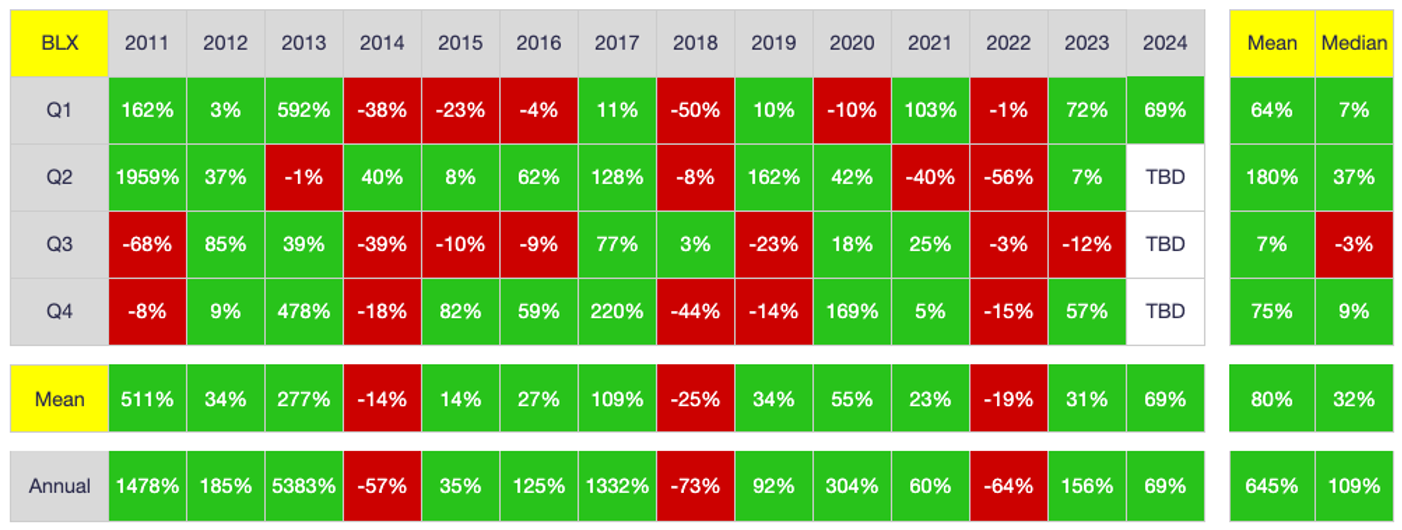
As shown, Q1 2024 was up a staggering 69%, making it the fifth highest Q1 return in BTC’s history. It also marks the fourth positive quarterly return of the past five quarters following the abject misery that was 2022.
In sum, BTC is on an unprecedented win streak right now, with up-only returns for most of the past 15 months. Whether this continues and to what degree remains to be seen. Again, as I have stated on many occasions, there are only three possible outcomes: 1) there will be a sizeable (30%+) correction soon; 2) gains that would otherwise have emerged post-halving are being pulled forward due to the launch of US ETFs; or 3) we really are in the early stages of a supercycle. While I am warming to the possibility of the latter scenario unfolding, I personally won’t become a believer until after I see how PA unfolds the next two months.
On-Chain Data
Below are the distribution of BTC addresses and coins for the past 12 months:
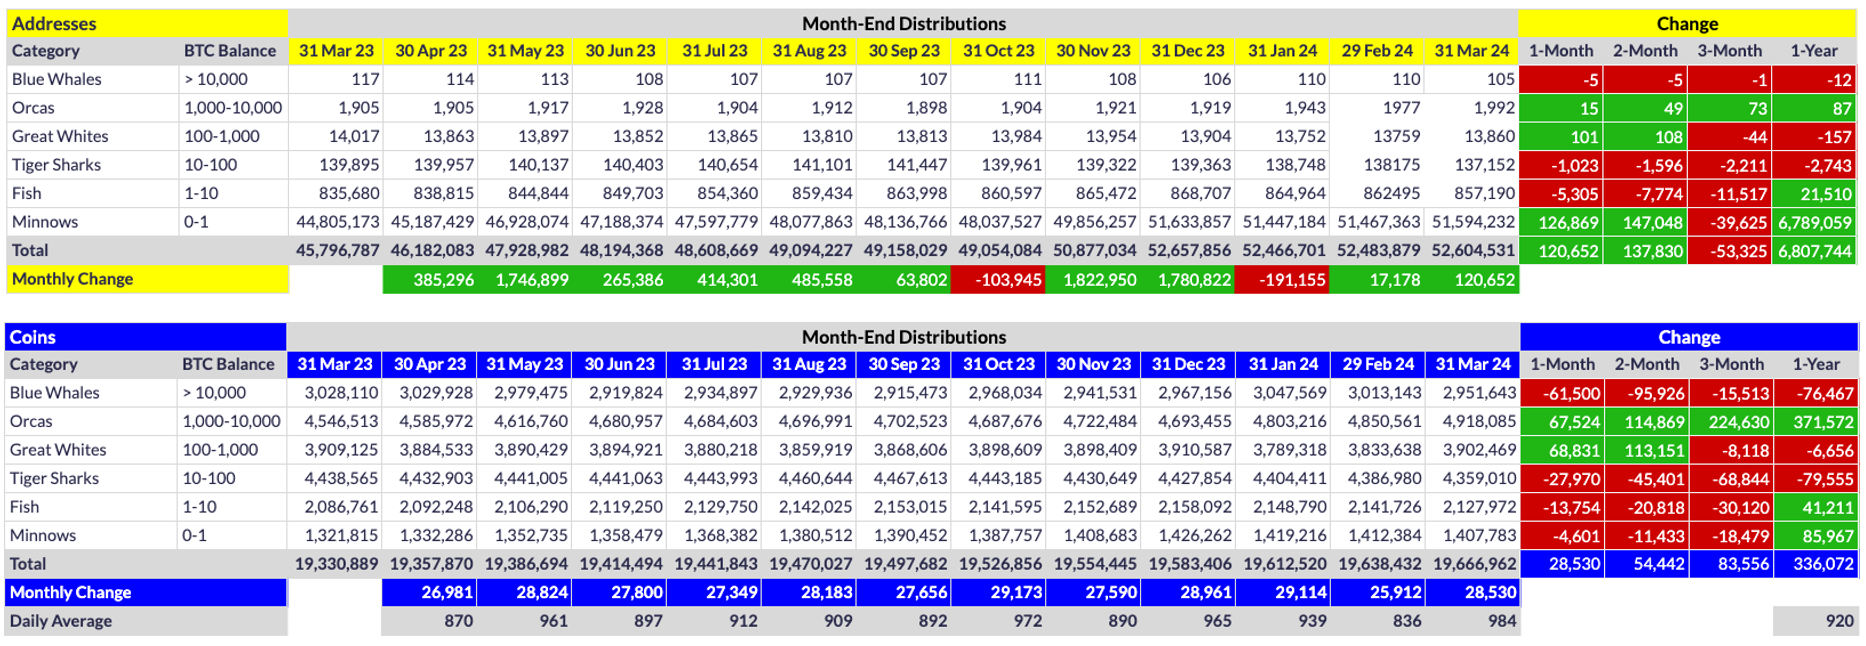
As shown, a net five Blue Whales devolved during March, shedding 61.5K coins in the process. BWs as a tier have in fact shed 95.9K coins the past two months, which is a non-trivial distribution, indicating profit-taking by some who accumulated heavily during the depths of the previous bear market. That said, and as shown later, a chunk of those BW coin losses are actually attributable to exchange outflows, so whale distribution has only begun as opposed to being in full swing.
This supposition is supported by the massive growth/accumulation that has occurred at the Orca level (and to a lesser extent, the Great White level). As shown above, a net 15 Orcas evolved during March, adding to their already substantial two-month (49), three-month (73) and 12-month (87) gains. The net coin gains by Orcas are even more impressive: 67.5K coins in March, 114.9K coins over two months, 224.6K coins over three months, and 371.6K gains over the past year.
To put this coin accumulation in perspective, look at how many new coins have been mined over the past 12 months: 336.1K. i.e., Orcas have devoured the net equivalent of every new coin mined the past 12 months along with an additional 35.5K coins from other tiers. Breathtaking.
Whether one lauds or laments such Orca accumulation depends on one’s perspective. Those who invest primarily for NGU (number go up), there is much reason to rejoice. Orca growth is arguably necessary for substantial and sustainable price growth, as I elucidated here. On the other hand, as shown in the table above, Minnows shed 4.6K coins in March despite increasing by 126.9K in number. Such a trend essentially means a greater number of retail investors are partaking in a much smaller pie. Admittedly, many retail investors have decided it is easier/better to invest in one of the new US Exchange Traded Funds (ETFs) than to self-custody, but for those who believe in BTC’s ethos, this trend is a troubling trend indeed.
Speaking of US ETFs, they are undoubtedly the primary reason for this level of coin concentration at the Orca level. As shown below, most US ETFs (with the exception of GBTC and BTCO) have been in serious growth mode since their launch 10 weeks ago:
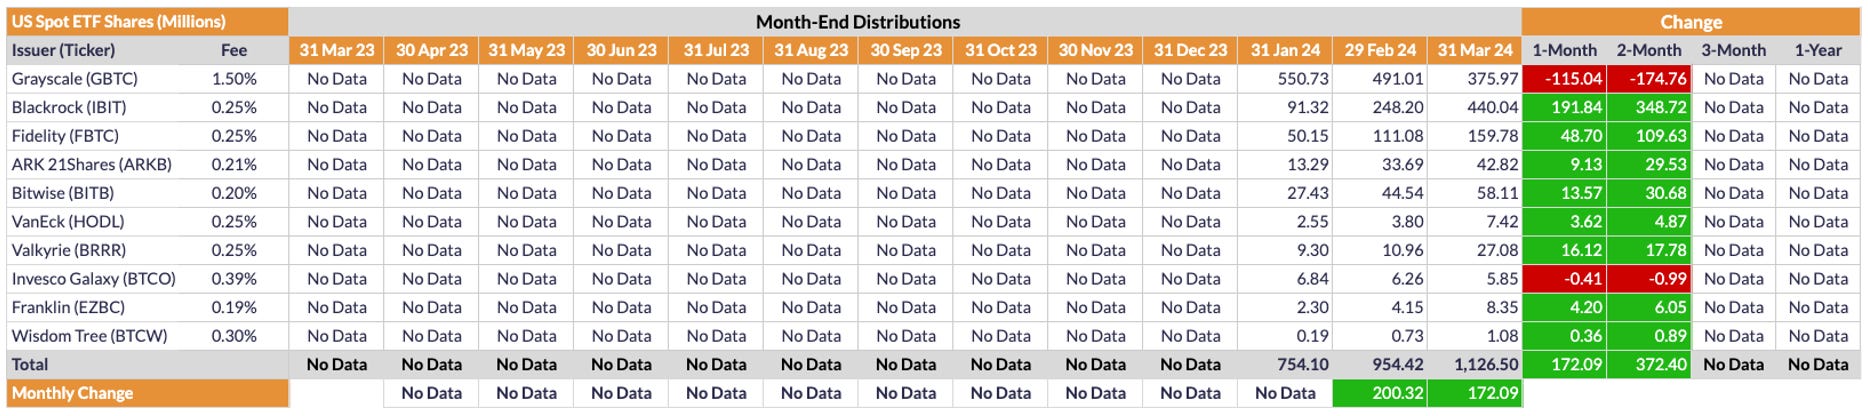
Note that the chart above illustrates changes in share count as opposed to assets under management (AUM) or market cap (MC). The reason I chose to track share counts is because it eliminates price as a variable. In other words, share-count changes illustrate absolute ETF growth/contraction as opposed to AUM or MC, which in part vary as a function of BTC’s price.
To illustrate the difference between share-count tracking and AUM/MC tracking, below is a table of ETF market cap values to date:
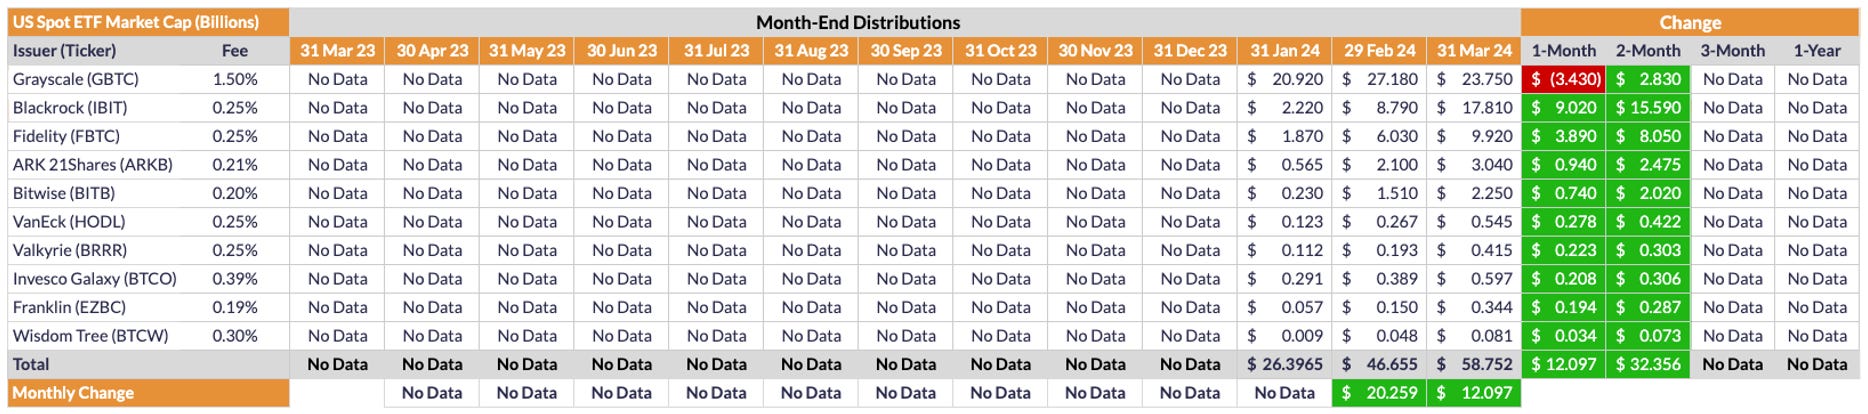
As shown, all ETFs but GBTC grew in market cap this past month and literally every single ETF has grown in market cap since inception. However, as most already know, GBTC has been hemorrhaging market share to IBIT, FBTC, et al. since ETF launch. In other words, BTC’s price has increased so dramatically since ETF launch that it has more than offset GBTC’s sizable contraction in terms of share count.
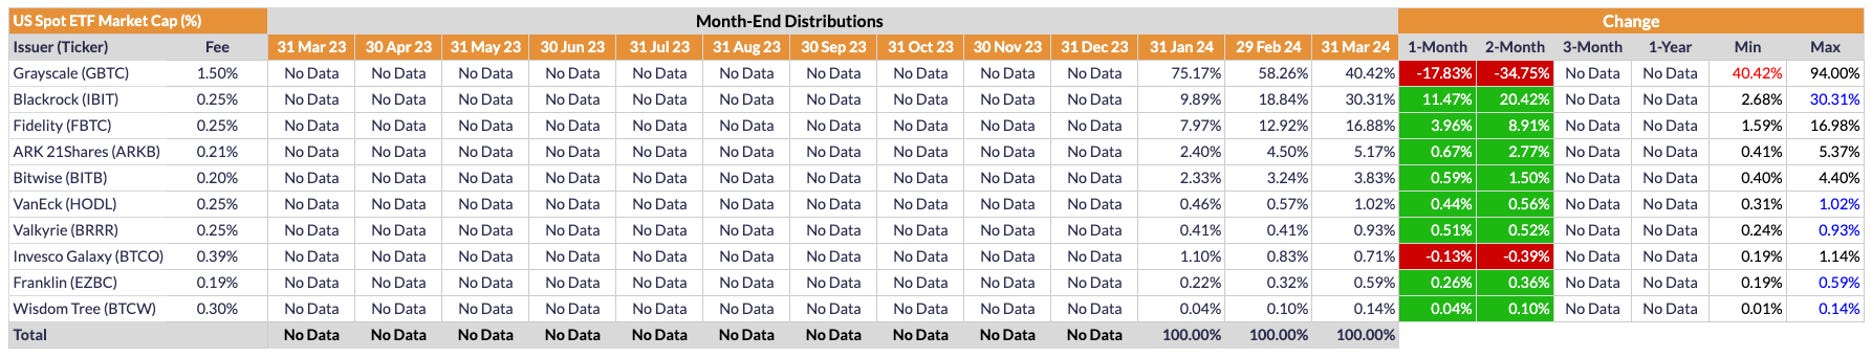
Put another way, GBTC has seen its share of the US ETF market drop from a peak of 94% at launch to a current low of 40.42%. It has in fact lost market share literally every single day it has traded, with IBIT and FBTC being the primary beneficiaries. At the current rate of contraction, IBIT should pass GBTC in market share within weeks, and it is possible (probable?) FBTC will also eventually pass GBTC in market share, unless of course Grayscale does something quickly to stem its hemorrhaging (NB: I actually have a conspiracy theory about what Grayscale is doing, but I’ll save it for a rainy day. Suffice it to say that I think Grayscale intends to liquidate GBTC. Details to follow if the current trend continues).
One other table to share before concluding. Below is a list of exchange flows for the past 12 months:
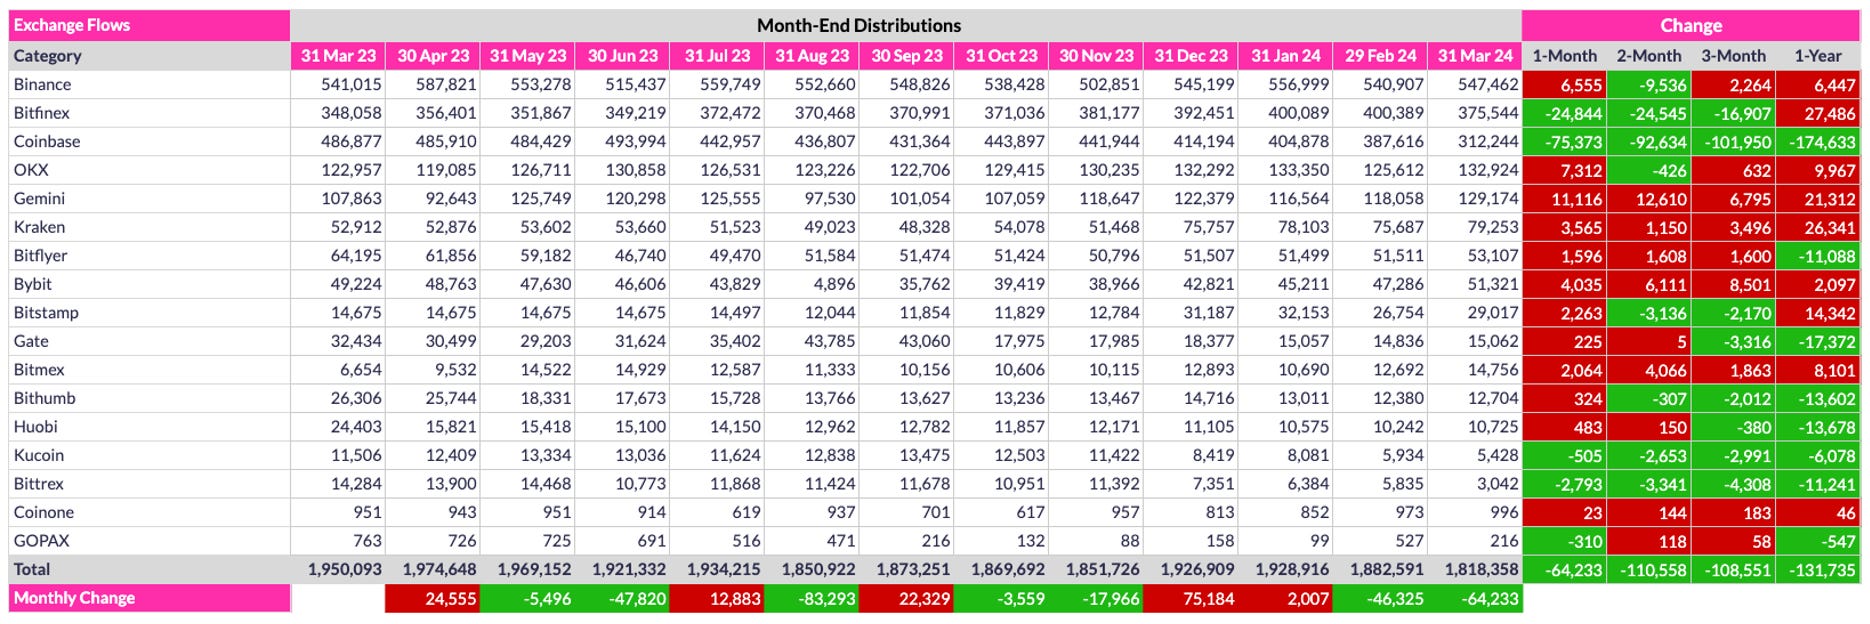
As shown, an impressive 64.2K coins left exchanges during March, with Coinbase and Bitfinex alone shedding more than 100K coins combined (i.e., the other exchanges combined actually experienced net inflows). Overall, March’s exchange outflow continues the trend of the past year, with 110.6K coins flowing out of the listed exchanges the past two months and 131.7K coins over the past twelve. Again, these outflows are most likely due to the launch of US ETFs, but exchange outflows have been the predominant trend for years, so there is every reason to expect it to continue, particularly with the next halving literally only days away.
Conclusion
March 2024 was another impressive month for BTC, extending its monthly win streak to seven. With the next halving less than three weeks away, it is hard to imagine April not also being an up month. That said, I continue to expect a 30%+ correction at some point, and likely sooner than later. Markets simply do not go up only, not even Bitcoin. Again, we are already in uncharted territory in terms of sustained price growth. Never in Bitcoin’s history has price increased seven consecutive months. Until now. For the most optimistic among us, such a trend could indicate that this time actually is different. I can rationally make an argument for such a claim, that this upcoming cycle will indeed be a so-called supercycle, finally reaching (or even eclipsing) gold as the preeminent store of value, at least in terms of market cap. However, the realist in me, the person who has seen many many market highs and lows over the past thirty years, has a hard time believing this time actually is different because it never is, at least not in modern times. But we shall see. I think Q2 PA will tell us a lot. We are certainly due for a sustained correction and no better time than immediately following the hype of the next halving. This is not to say price has to completely faceplant in Q2, but at least one or two months of negative returns seems reasonable, even likely. But hey, I’ve been wrong before and undoubtedly will be again. Here’s to hoping this is one of those times.
Go #BTC.