Disclaimer
The on-chain data I use (BitInfoCharts, Bybt, CoinMarketCap) to compile the tables and graphs contained in this analysis do not always align with the on-chain data found via others sources like Glassnode and CryptoQuant. I cannot fully explain the reason for the differences nor can I confirm which sources are most accurate. For this and other reasons, I have come to trust only my own on-chain analysis when trying to explain and/or predict Bitcoin’s price action (PA). Whether you too find my analysis useful is for you to decide, but I can assure you that some of my observations and/or predictions differ, often markedly, from other observations and/or predictions you may see on Crypto Twitter (CT) and elsewhere.
Introduction
Below are three tables illustrating changes to the distribution of active Bitcoin (BTC) addresses and coins throughout the month.
Analysis
September started out strongly for Bitcoin (BTC), up 11.9% the first six days of the month, opening at $47,110 (on Coinbase) and peaking at $52,945 on September 6 before an 11% nosedive on September 7, the same day BTC became legal tender in El Salvador. No one will ever convince me that swoon was coincidental, or even a “sell the fact” event after people “bought the rumor” in the weeks leading up to it. There simply is no question in my mind it was orchestrated to try to shake confidence in BTC as a currency/store of value, as I explain here. Regardless of the reality, the swoon led to a more significant downturn, with BTC every-so-briefly breaching the $40,000 level, reaching a nadir of $39,600 on September 21, before clawing its way back up to $43,824 by month-end. Overall, BTC ended the month down 7%, which, while obviously not a great outcome, is a whole lot better than it could have been. That said, it is worse than I had predicted in my August month-end analysis:
I expect September to trade near-flat, or perhaps modestly to the upside, simply because the preponderance of months during BTC bull phases are green. That said, given that both July and August 2021 were strong months to the upside, with a cumulative increase of 36.6% off the June low, it is possible September will trend lower, but again, only mildly so if at all.
Combined with downward price pressure on US equities throughout the month and yet the latest iteration of China banning BTC, there simply was too much bearishness for BTC to overcome. PA aside, however, there are some reasons for optimism hidden within the September on-chain data, as described below.
As shown above, there was a general exodus from the BTC market during September, with 88.6K fewer active addresses than in August. This is unsurprising of course, not only because price closed 7% lower, but also because of the exceptional (and unexpected) price volatility throughout the month. That said, a net 31 Orcas evolved during September (excluding the two devolved Blue Whales), which is a very promising sign. As I described at length in this article, I have come to believe quite strongly that changes in whale addresses determine how sustainable changes in price will be. i.e., When there is a substantial increase in the number BWs and Orcas, then price will substantially and sustainably increase as well. In the absence of new whales, however, price is much more susceptible to the sentiment of retail investors, who typically react more strongly to news or even just rumors.
Changes in the on-chain data I track strongly support my thesis that most current whales (excluding exchange wallets) are what I call “bottom feeders,” meaning they step in to buy BTC whenever it dips, but they also sell BTC into market strength, particularly sustained strength. The quintessential example of this behavior is the third largest wallet, the only non-exchange wallet that holds > 100K BTC.
As shown, this whale acquired 2,831 BTC in September despite, or more likely due to, the significant downward price pressure throughout the month. This behavior is typical of large long-term hodlers; they buy during significant dips. It is in fact these whales that we have to thank for price remaining largely above $40K throughout the month; they help solidify the price floor in times of excessive sell-side pressure.
Conversely, they do little to sustainably boost price because many of them also sell into strength. As shown above, the third largest whale is NOT strictly a hodler; they have sold on 54 occasions, almost always into strength, presumably to increase their working capital for subsequent dips. This behavior is in fact the reason price has stagnated recently, well below the all-time high near $65K. Unless/until new whales enter the market en masse, price will continue fluctuating within a relatively narrow range ($40K-$55K). Retail investors simply do not have the purchasing power to move price sustainably higher at these 5-figure price levels. I refer you once again to my recent article on whale influence on price for a more detailed discussion on this topic.
Within that context, however, the meaningful increase in Orcas during September could prove to be a bellwether, particularly if/when BWs also reverse course and start increasing in number.
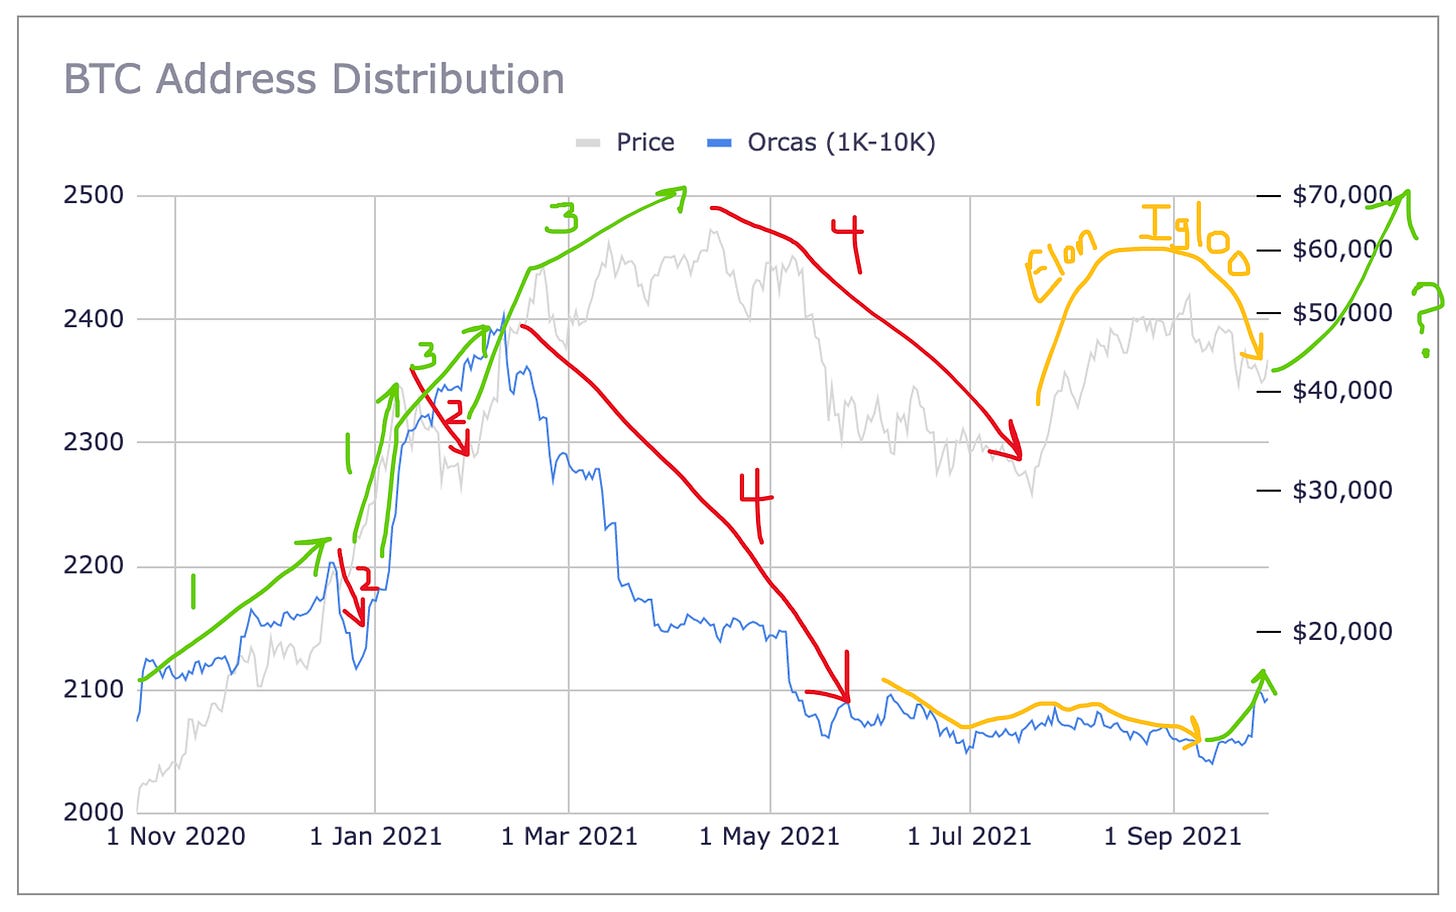
As shown above, changes in Orca count reliably precede changes in price. More specifically, these data indicate that changes in Orca count precede changes in price by about two weeks. As shown below, Orcas recently bottomed out at 2,040 on September 13 but achieved a recent local peak of 2,099 just a few days ago (September 27), an impressive increase of 59 Orcas over that two-week period. To put that number into perspective, the average Orca hodls 2,543 BTC, so 59 average Orcas hold $7B worth of BTC at today’s prices. That is a non-trivial amount of BTC and the reason I believe price will sustainably increase if this increase in Orca count does not wane.
If indeed this Orca trend continues, we could very well see not only a significant increase in BTC price over the coming weeks/months, but also a more sustainable increase in price. But the current Orca trend MUST continue and, ideally, BWs would also begin increasing in number again.
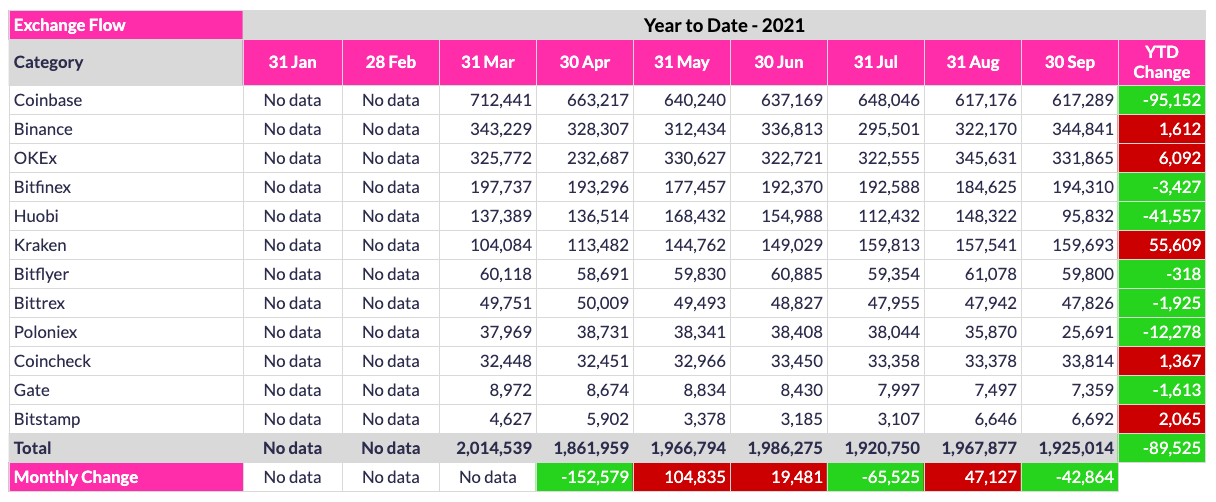
Unlike address changes, September coin flows are much less clear. For example, as shown above, BWs shed 59.1K coins during September, with all but a net 1K of these coins going into Orca wallets (who added 58.1K coins). That said, a net 41.1K of the 59.1K BW coin reduction appears to have come from exchange wallets. Normally, such a huge exchange outflow would be interpreted as bullish. However, when digging deeper, note that Huobi reported a 45.7K outflow for the month, meaning all other exchanges had a combined inflow of 4.6K coins. Because Huobi data were extremely erratic throughout the month (e.g., fluctuating from a 12K inflow to a 12K outflow and then back to an inflow within a matter of hours), I am reluctant to draw any conclusions about how many coins actually outflowed from Huobi during September. Put another way, the accuracy of Huobi’s reported exchange flow data is questionable at the moment, so it is worth postponing any conclusions based on overall exchange flows until we see whether Huobi’s data stabilize.
Regardless, as shown below, coins on balance have flowed out of exchanges throughout 2021, with a reported 89.5K having outflowed since March 31. In other words, despite the exceptionally volatile price action of the past six months, more coins on balance have flowed out of exchanges than into exchanges. If past bull phases are any indication of future behavior, it would seem that the largest market participants expect the bull phase of this cycle to continue at some point, as coins typically flow into exchanges when PA is most bullish. Put another way, whales in general are stockpiling coins at the moment, presumably in anticipation of subsequent price strength that they can sell into to generate a substantial profit.
While many of us on CT continue analyzing every microscopic change in price, it is important not to lose sight of the larger picture. As shown below, a staggering 4.3M new Minnows have emerged since January 31 of this year.
Put another way, an average of 18,000 new retail participants have joined the BTC network every single day over past eight months. That is incredible. And to think we are still only at the base of the S-curve of innovation adoption. Oh my. How can one not be bullish on the future of BTC?
Conclusion
September 2021 proved to be a less-than-auspicious month for Bitcoin despite my anticipation of something better. i.e., It would appear there are indeed some seasonal aspects to Bitcoin PA, with September being a down month a more reliable seasonal indicator than most. That said, if you managed to spend the month in a slumber like Green Day, then you might find some solace upon waking that @100trillionUSD is 2-for-2 in calling monthly bottoms despite the 7% drawdown in price. More importantly, there are numerous reasons to be optimistic as we look ahead to Q4. For example, the threat of a US ban of BTC has been quelled for now and the belief that the US Securities and Exchange Commission (SEC) will approve a BTC Exchange Traded Fund (ETF) sooner than later is as strong as ever. While I continue to believe a BTC futures ETF is NOT in the best interest of retail investors, it is certainly a step in the right direction and should, if nothing else, be a significant (if temporary) catalyst for price. But once again, and I cannot state this often enough, price increases most substantially and sustainably occur when new whales enter the market, so let’s all hope and pray the current upswing in Orcas continues and that the number of Blue Whales also begins trending up. In the meantime, I will undoubtedly continue tracking such changes with great rigor (and optimism) in the weeks and months ahead, given how convinced I am that changes in whale addresses are the most reliable indicator of future price action.
Go BTC.


Amazing and insightful article. Your work is super inspiring to me as a writer. Will keep my ears open for any updates! Cheers
I actually follow your reports now more than the others. I totally agree, without big movers, we ain't going anyway.