
Month-End Analysis

Disclaimer
The data I use (BitInfoCharts, Coinglass, CoinMarketCap) to compile the tables and graphs contained in the on-chain section of this analysis do not always align with data found via others sources like Glassnode and CryptoQuant. I cannot explain the reason for the differences nor can I confirm which sources are most accurate. For this and other reasons, I have come to trust only the on-chain data I collect when trying to explain and/or predict Bitcoin’s (BTC) future price action (PA). Whether you too find my on-chain analysis useful is for you to decide, but I can assure you that some of my observations and/or predictions will differ, often markedly, from other observations and/or predictions you will see on Crypto Twitter (CT) and elsewhere.
Price Action
Bitcoin opened May at $29,240 (on BLX) and closed the month at $27,223, a drop of 6.92%. Peak to trough, price peaked at $29,850 on May 6 and reached its nadir ($25,810) only six days later, on May 12. Although price experienced a 13.3% peak-trough swing during this six-day period, price generally trended down throughout the month. In fact, for the chartists among us, there is plenty of reason for bearishness right now, with price generally trending lower since mid-April, as shown below.

That said, I would argue current PA is acting perfectly predictably, especially given current retail dominance in the market. Note the following excerpt from my month-end analysis last month:
That said, the weekly chart below is not as overtly bullish as the monthly chart above. As shown, while current price is well above both the 200-week moving average (WMA) and the so-called bull-market support band (BMSB), the RSI is near the top end of the range (75), and on declining/low volume to boot.

In other words, it is possible that the current rally is losing steam. This thesis is reinforced by recent on-chain data distributions, as delineated later. That said, while pullbacks are painful in the moment, if price were to pull back to one or both of these key indicators in the near term, it would actually be healthy for the market because excess leverage would get flushed along the way (assuming of course one or both indicators ultimately holds as support).
As shown above, the 200WMA is currently sitting just below $26K and the BMSB just below $25K. Both are rising, however, so a near-term retest of either/both would likely occur around $25.5K.
As predicted, what I suggested could happen in May, did. Almost to the dollar, in fact. This is NOT to suggest I can predict future PA, as so many chartists claim they can. It simply makes sense to me that PA would unfold this way, especially with the market dominated by retail buyers and sellers. Importantly, however, both the 200WMA and BMSB did in fact hold as support in May, so the pullback should be viewed positively, in my opinion, provided of course they continue to hold as support. But will they?
To answer this question, I would argue we can look to historic halving-cycle PA:
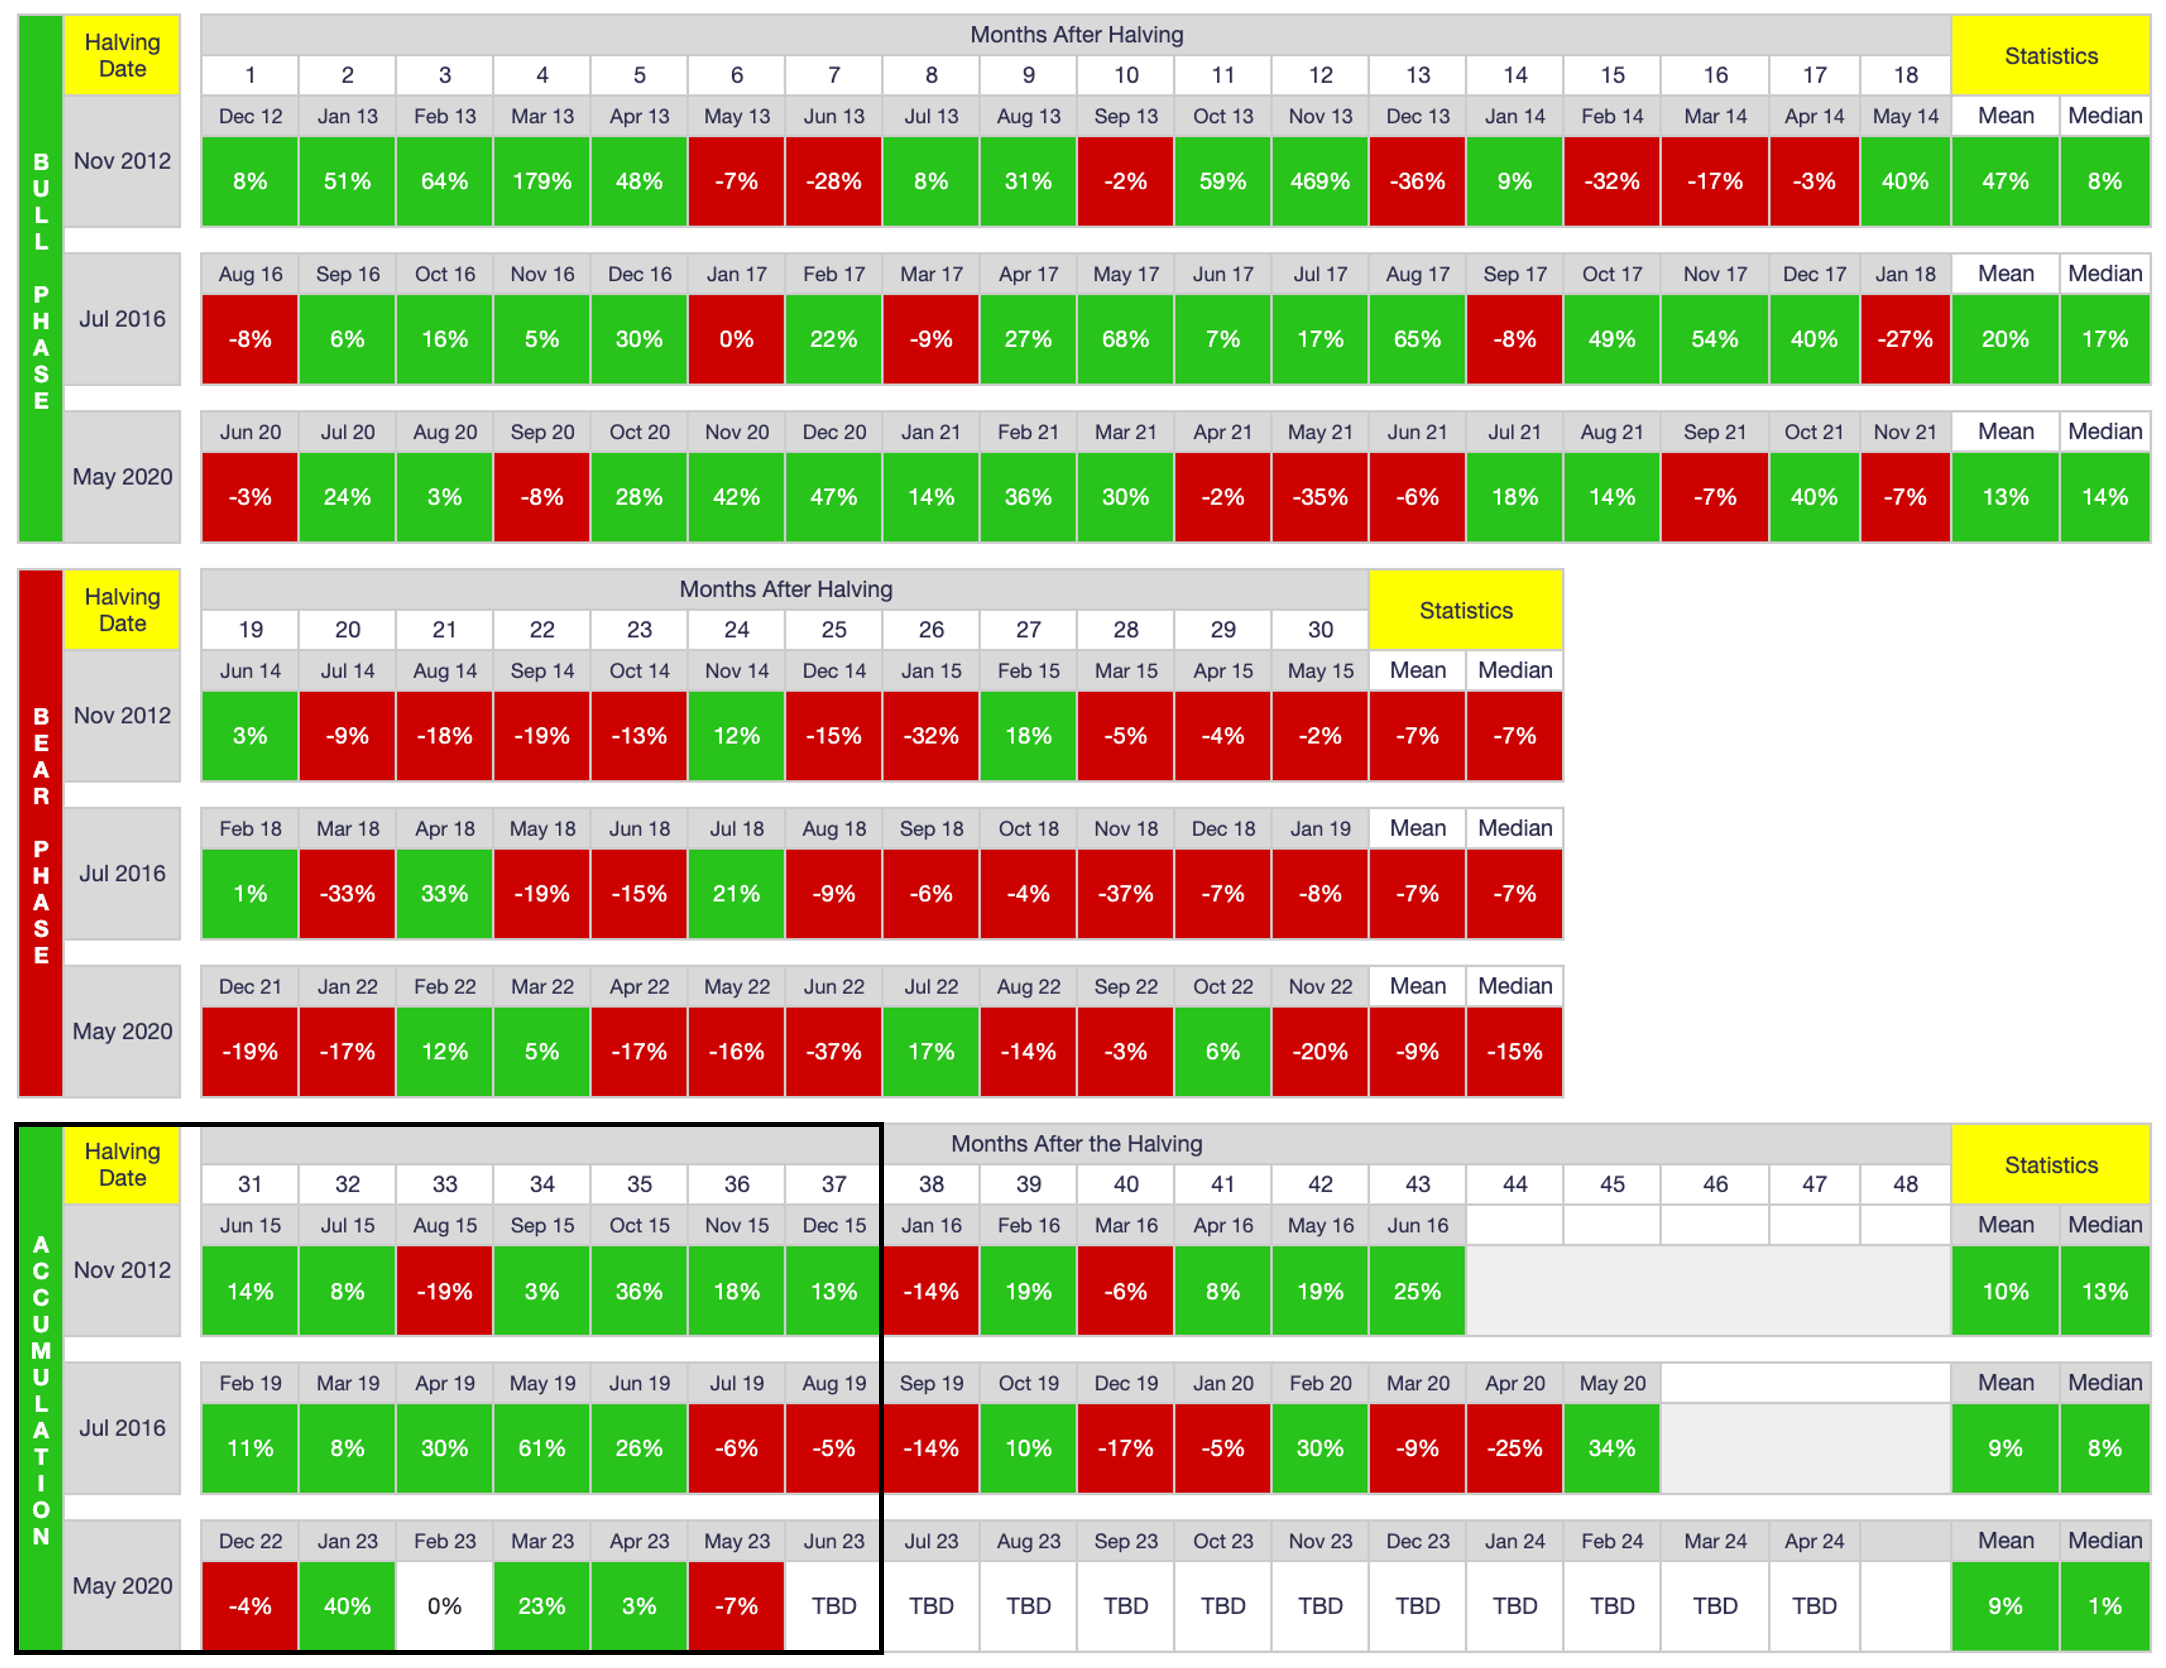
As shown above, current PA is completely in line with what I call the (re)accumulation phase of the BTC halving cycle, which is punctuated by more up months than down months but is nevertheless a mix of the two. For a variety of reasons, I personally believe the current (re)accumulation phase is more similar to that of the 2012 halving cycle than the 2016 halving cycle. As such, despite the current doom and gloom present on CT and elsewhere, I think June has a very good chance of being an up month rather than a down month. This prediction of course flies in the face of the popular “sell in May and go away” mantra, but as I illustrated on Twitter, this adage does not apply to BTC in the same way it does to US equities, particularly when retail traders dominate the market, as they do now.
The chart I shared on Twitter is updated below, with the May 2023 return added:
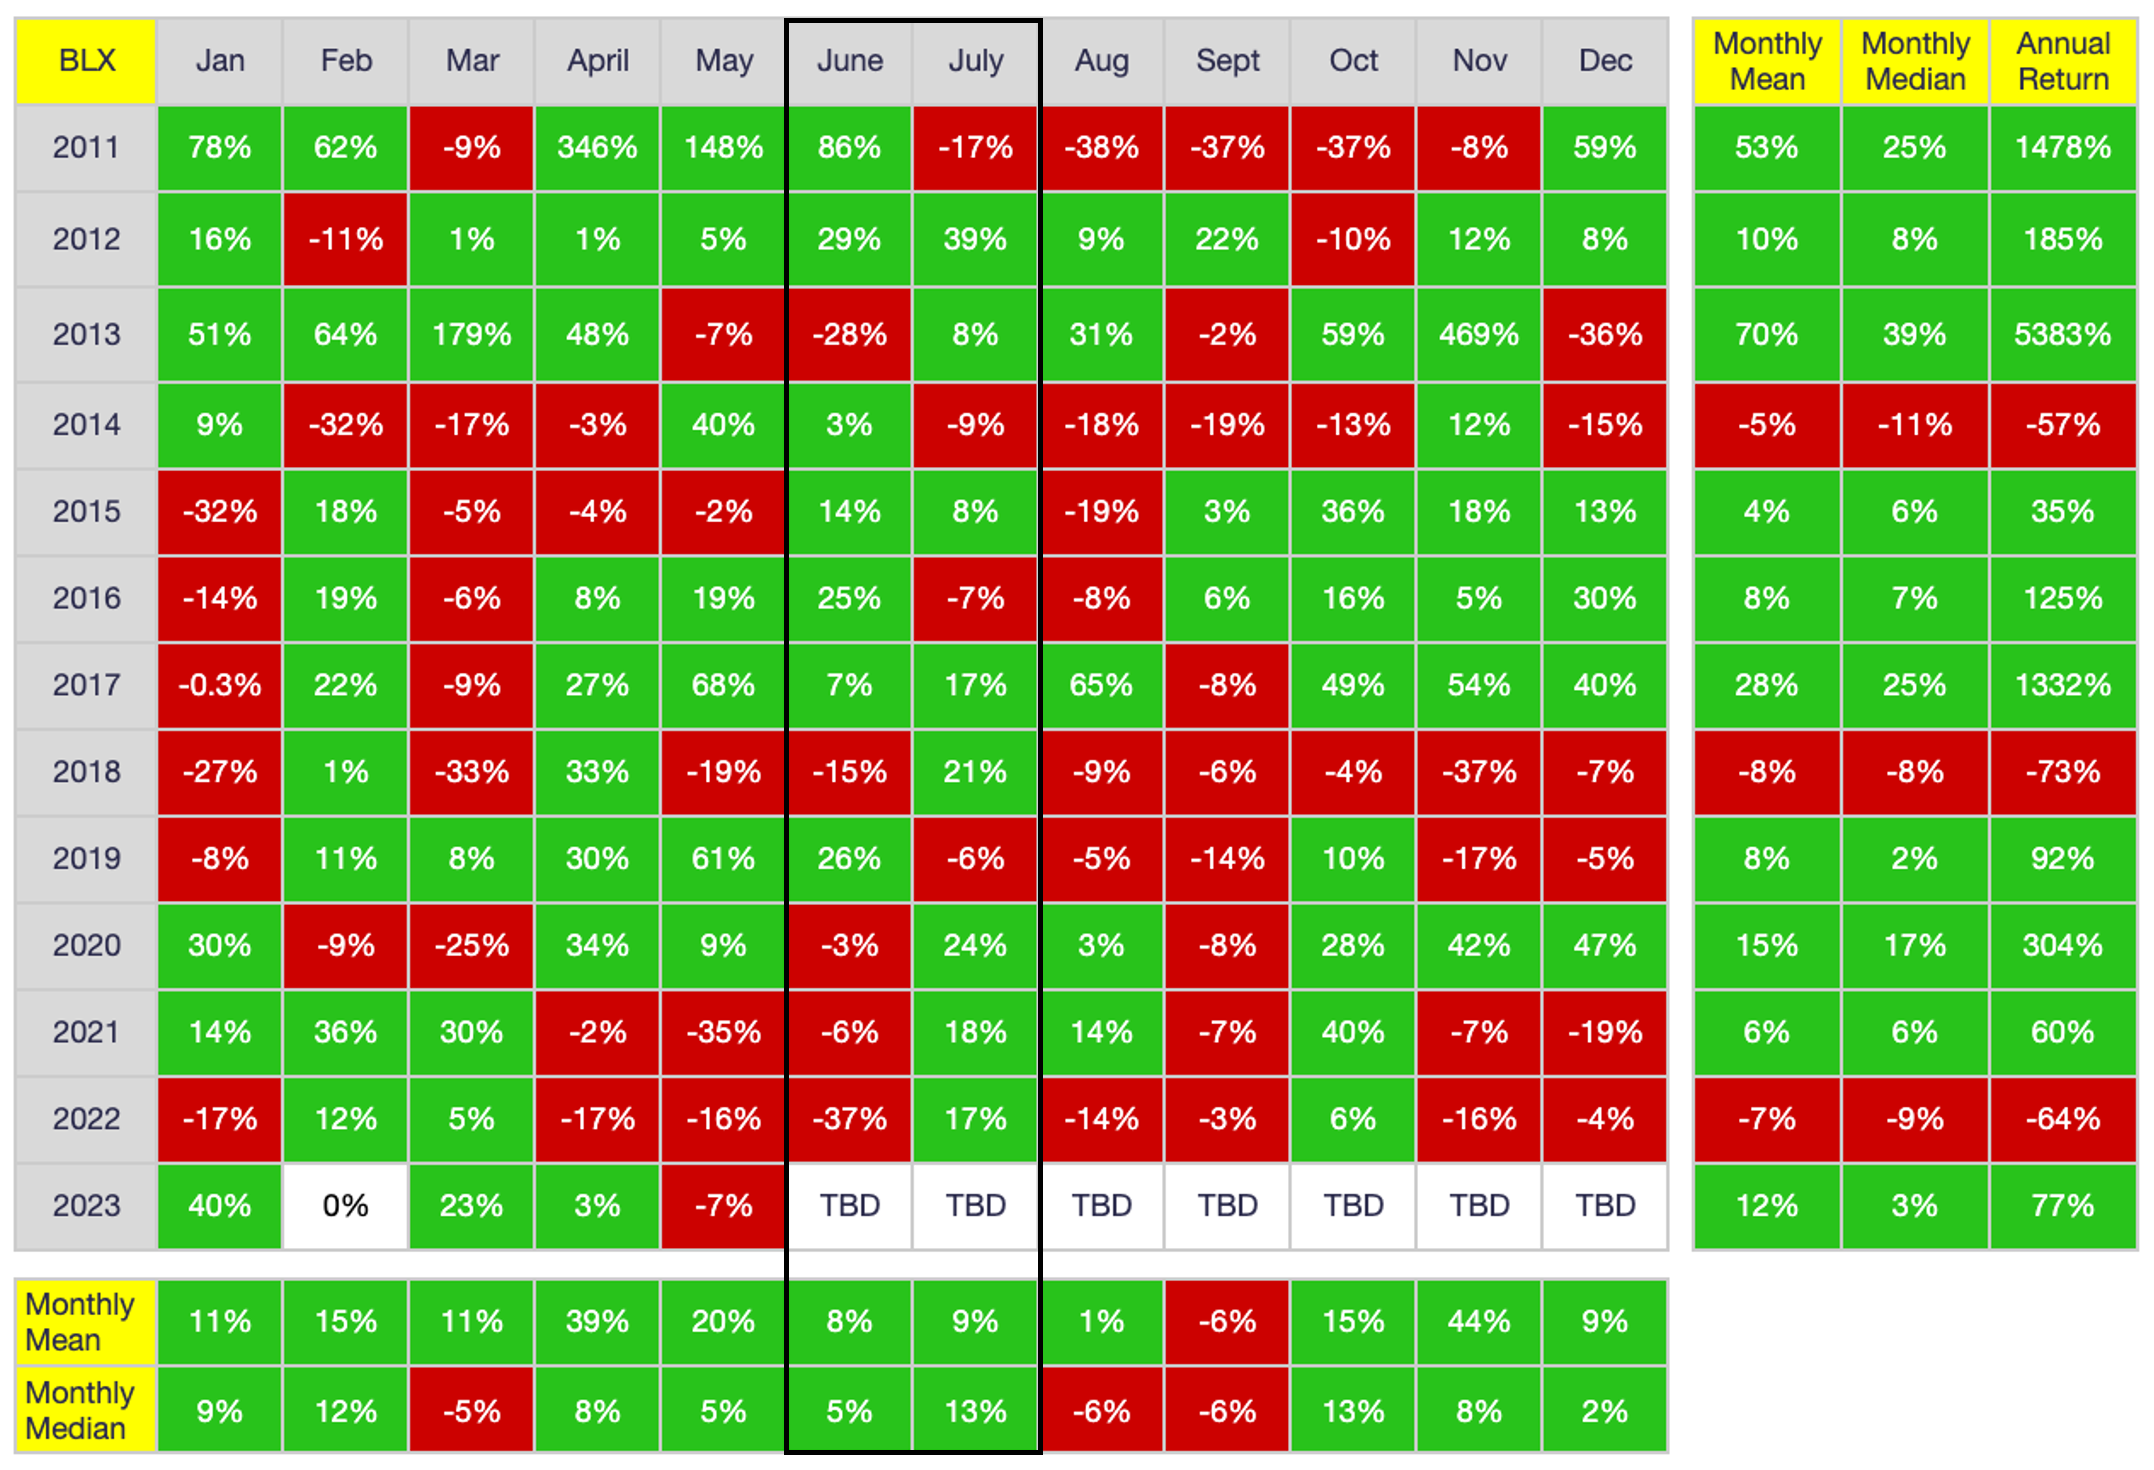
As shown above, it could be argued that June 2023 will be a down month given that it has been the previous three years. However, I personally think this trend will reverse this year, principally because I have more confidence in the rhythm of the halving cycles than I do in calendar-month predictions per se. Time will tell of course, and no one should make any investment decisions based on my “predictions,” but I do think June will be a bounce-back month after the modest decline in May.
If, on the other hand, June does close lower, then it would suggest the current (re)accumulation phase is more similar to that of the 2016 halving cycle than the 2012 halving cycle. One reason I do not think this is the case, however, is because the 65% gain year-to-date, while impressive, is downright modest compared to the exponential gain in the first half of 2019, when price quadrupled from trough to peak. As such, there is no reason to expect a significant multi-month drawdown. Yes, there are macroeconomic risks lurking everywhere, but short of a global meltdown, there is no reason to think BTC is headed for a significant drawdown despite the general downward trend the past six weeks. If anything, I would argue the opposite is true. As shown earlier, the 200WMA and BMSB both held support in May, which should be seen as bullish. That said, this does not mean we are in the early days of a new bull run - we clearly are not, as I will illustrate later via current on-chain data. However, neither are we on the precipice of another savage swoon. In my opinion.
On-Chain Data
Below is the distribution of network addresses for the past 12 months.

As shown, network growth was very bullish in May despite downward PA. While one Blue Whale devolved, every other tier experienced gains, including a net gain of 11 Orcas and nearly three dozen Great Whites. Even more notable, however, is the 1.75M gain for Minnows, the largest monthly gain on record. If one is looking to be bullish on the future of BTC, this is certainly a very compelling data point. That said, the gains should be contextualized, which is to say that this exponential network growth seems to have been driven more by the creation of Ordinals than a sudden spike in the belief that BTC is the ultimate store of value. The question of course is whether exponential growth is good regardless of the reason. I personally would argue yes, especially over the longer-term, but I know a lot of so-called maximalists disagree, instead preferring to preserve the “purity” of BTC as the the ultimate store of value even if that means slower network adoption.
Regardless of which side one falls along this philosophical divide, interest in Ordinals explains why there has been such massive address growth without commensurate price appreciation: most new growth has been people creating wallets to dabble in Ordinals rather than to accumulate BTC per se. The amounts purchased were micro-amounts, so they simply didn’t lead to any price appreciation.
This thesis is reinforced by the utter lack of volume recently. As shown below, volume in May 2023 was lower than it has EVER been (excluding the very early years), with only April 2022 coming even close.

In other words, despite massive network growth in terms of wallets/addresses, very little buying/trading is actually happening. Most recent purchases have been micro-purchases, presumably just to play around with Ordinals rather than because of a sudden spike in the belief that BTC is the ultimate store of value.
Such historically anemic volume is also undoubtedly due to the decimation of institutional investment, particularly in the US. i.e., Not only did institutional momentum take a massive hit due to the failures of BlockFi, Celsius, FTX and others, the current anti-crypto stance of many US politicians and a lack of regulatory clarity have gutted US institutional enthusiasm for BTC. As such, I would argue that no one should be talking about another bull run until volume increases substantially.
Put another way, only institutions can buy in lot sizes large enough to move price both substantially and sustainably, so we longs better pray for US regulatory clarity sooner than later as well as more political support (or at least less overt political resistance). Fortunately, there is reason for optimism: I think Grayscale will win their lawsuit against the US Securities and Exchange Commission (SEC), thus ushering in the approval of the first US spot-BTC exchange-traded fund (ETF). Once this occurs, regulatory clarity will (more) quickly follow, in my opinion. And if Grayscale win their lawsuit shortly before the next halving? Look out above…
Despite the recent lack of volume illustrated above, there has been a small uptick in Orca addresses recently, which is encouraging for the reasons I explain here and here:
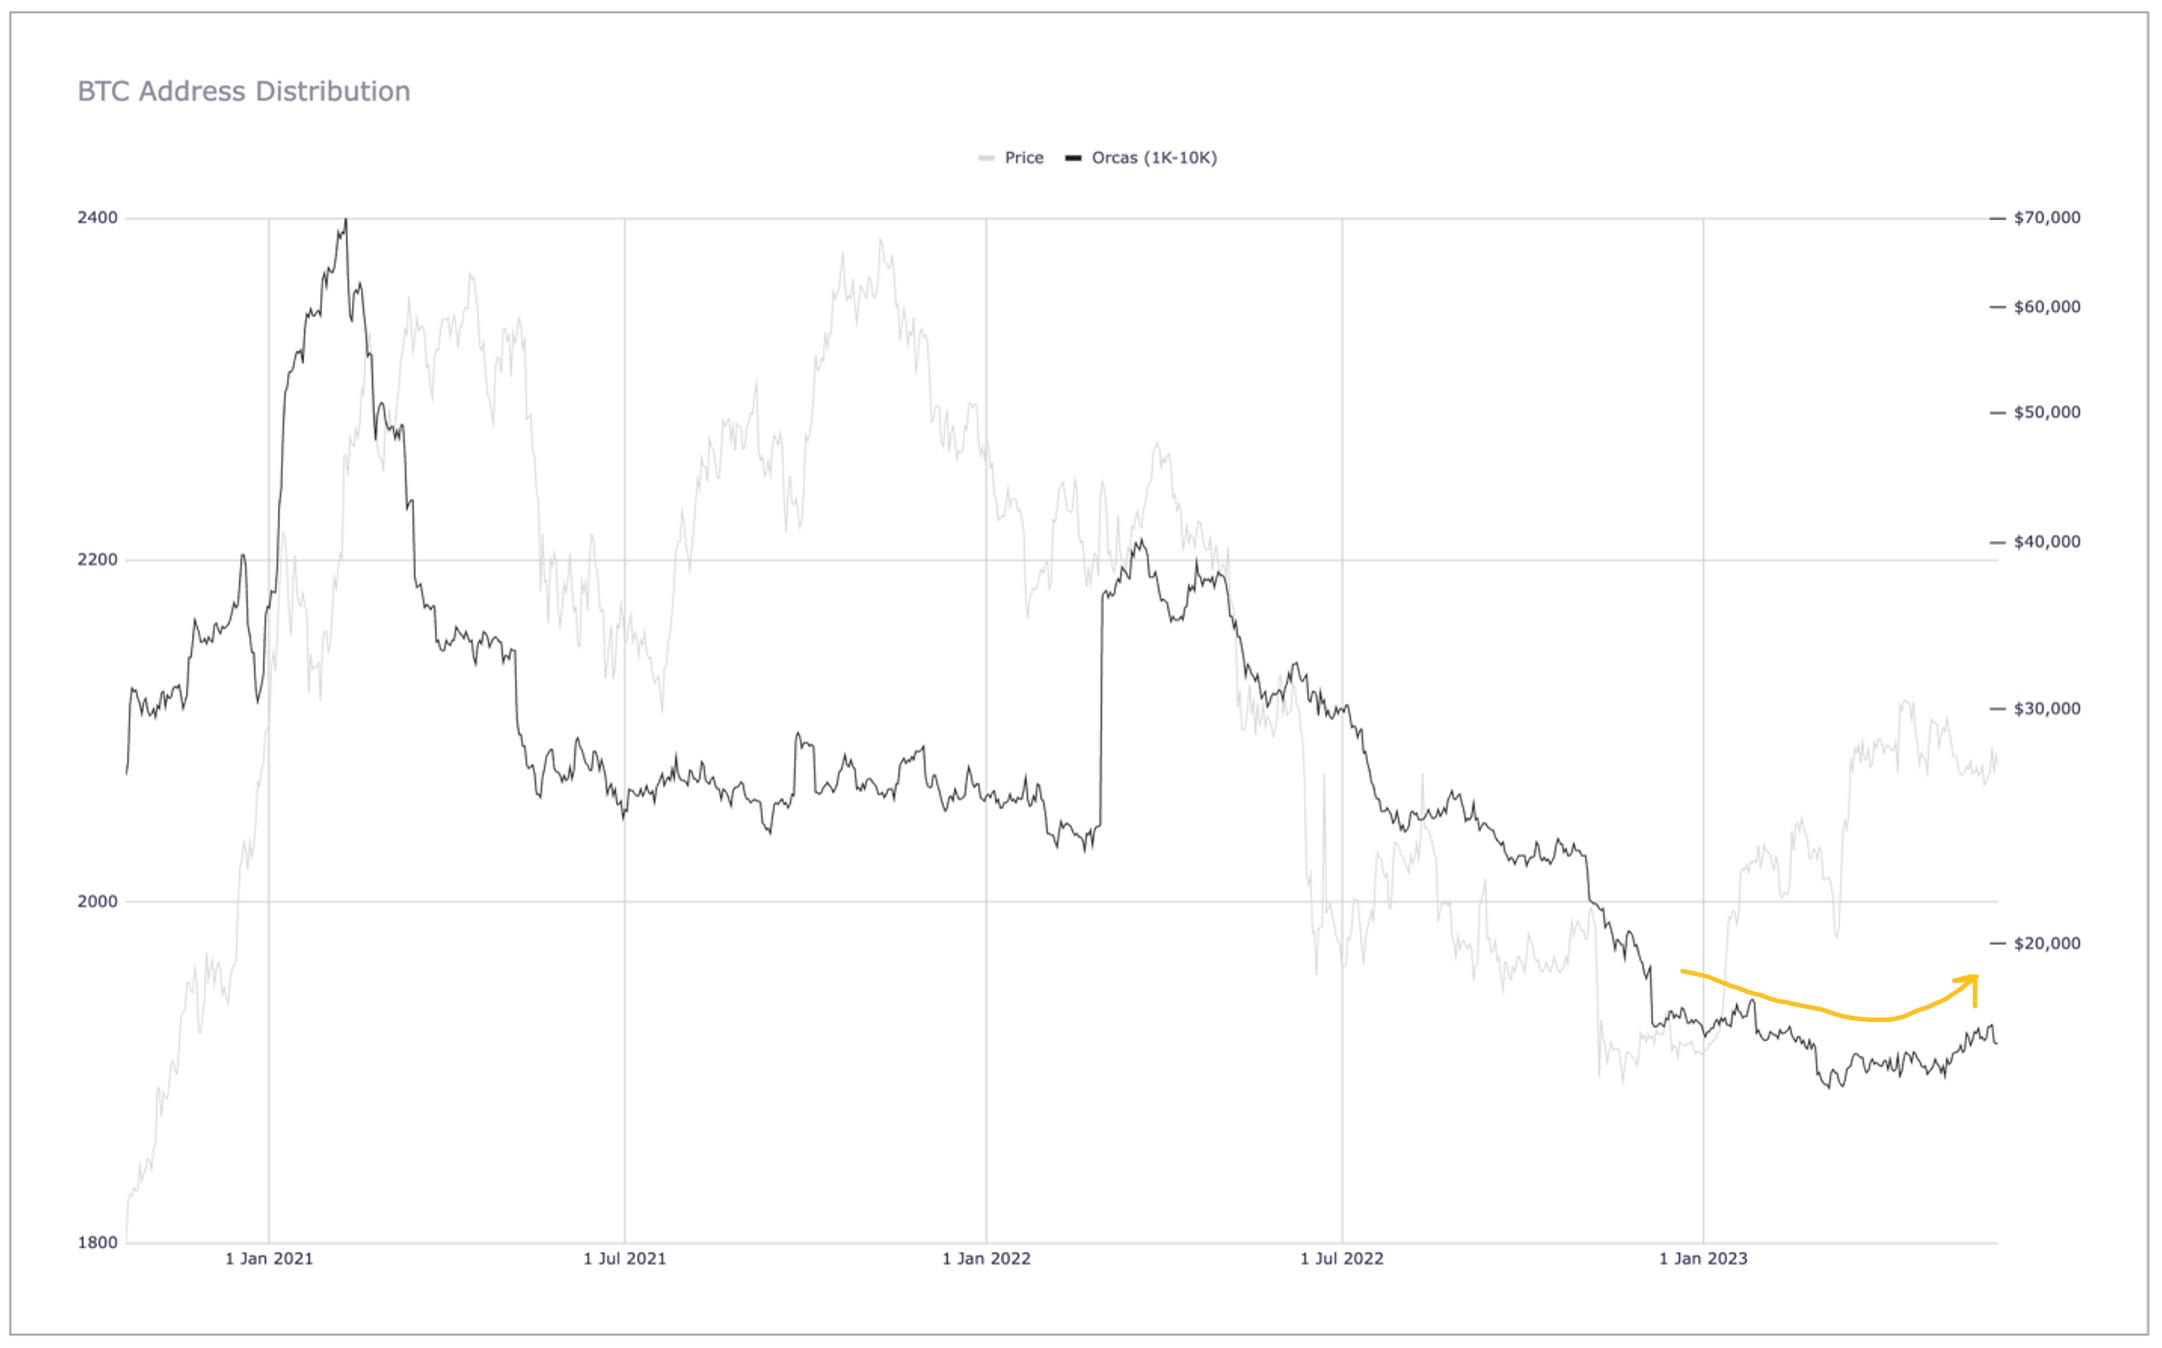
As shown in the above chart as well as the address table presented earlier, there have been net Orca gains over the past 90 days, which is a very welcome trend following a relentless decline that began in February 2021. If Orca numbers have indeed finally bottomed, that should provide some support for current price levels. However, Orca numbers need to start climbing by leaps and bounds before price will experience anything other than modest and ephemeral gains. That said, a lack of institutional selling also means there is no one left to crater price either, which should be welcome relief after the bloodbath that occurred during 2022.
Below are the coin and exchange-inventory distributions over the past 12 months.
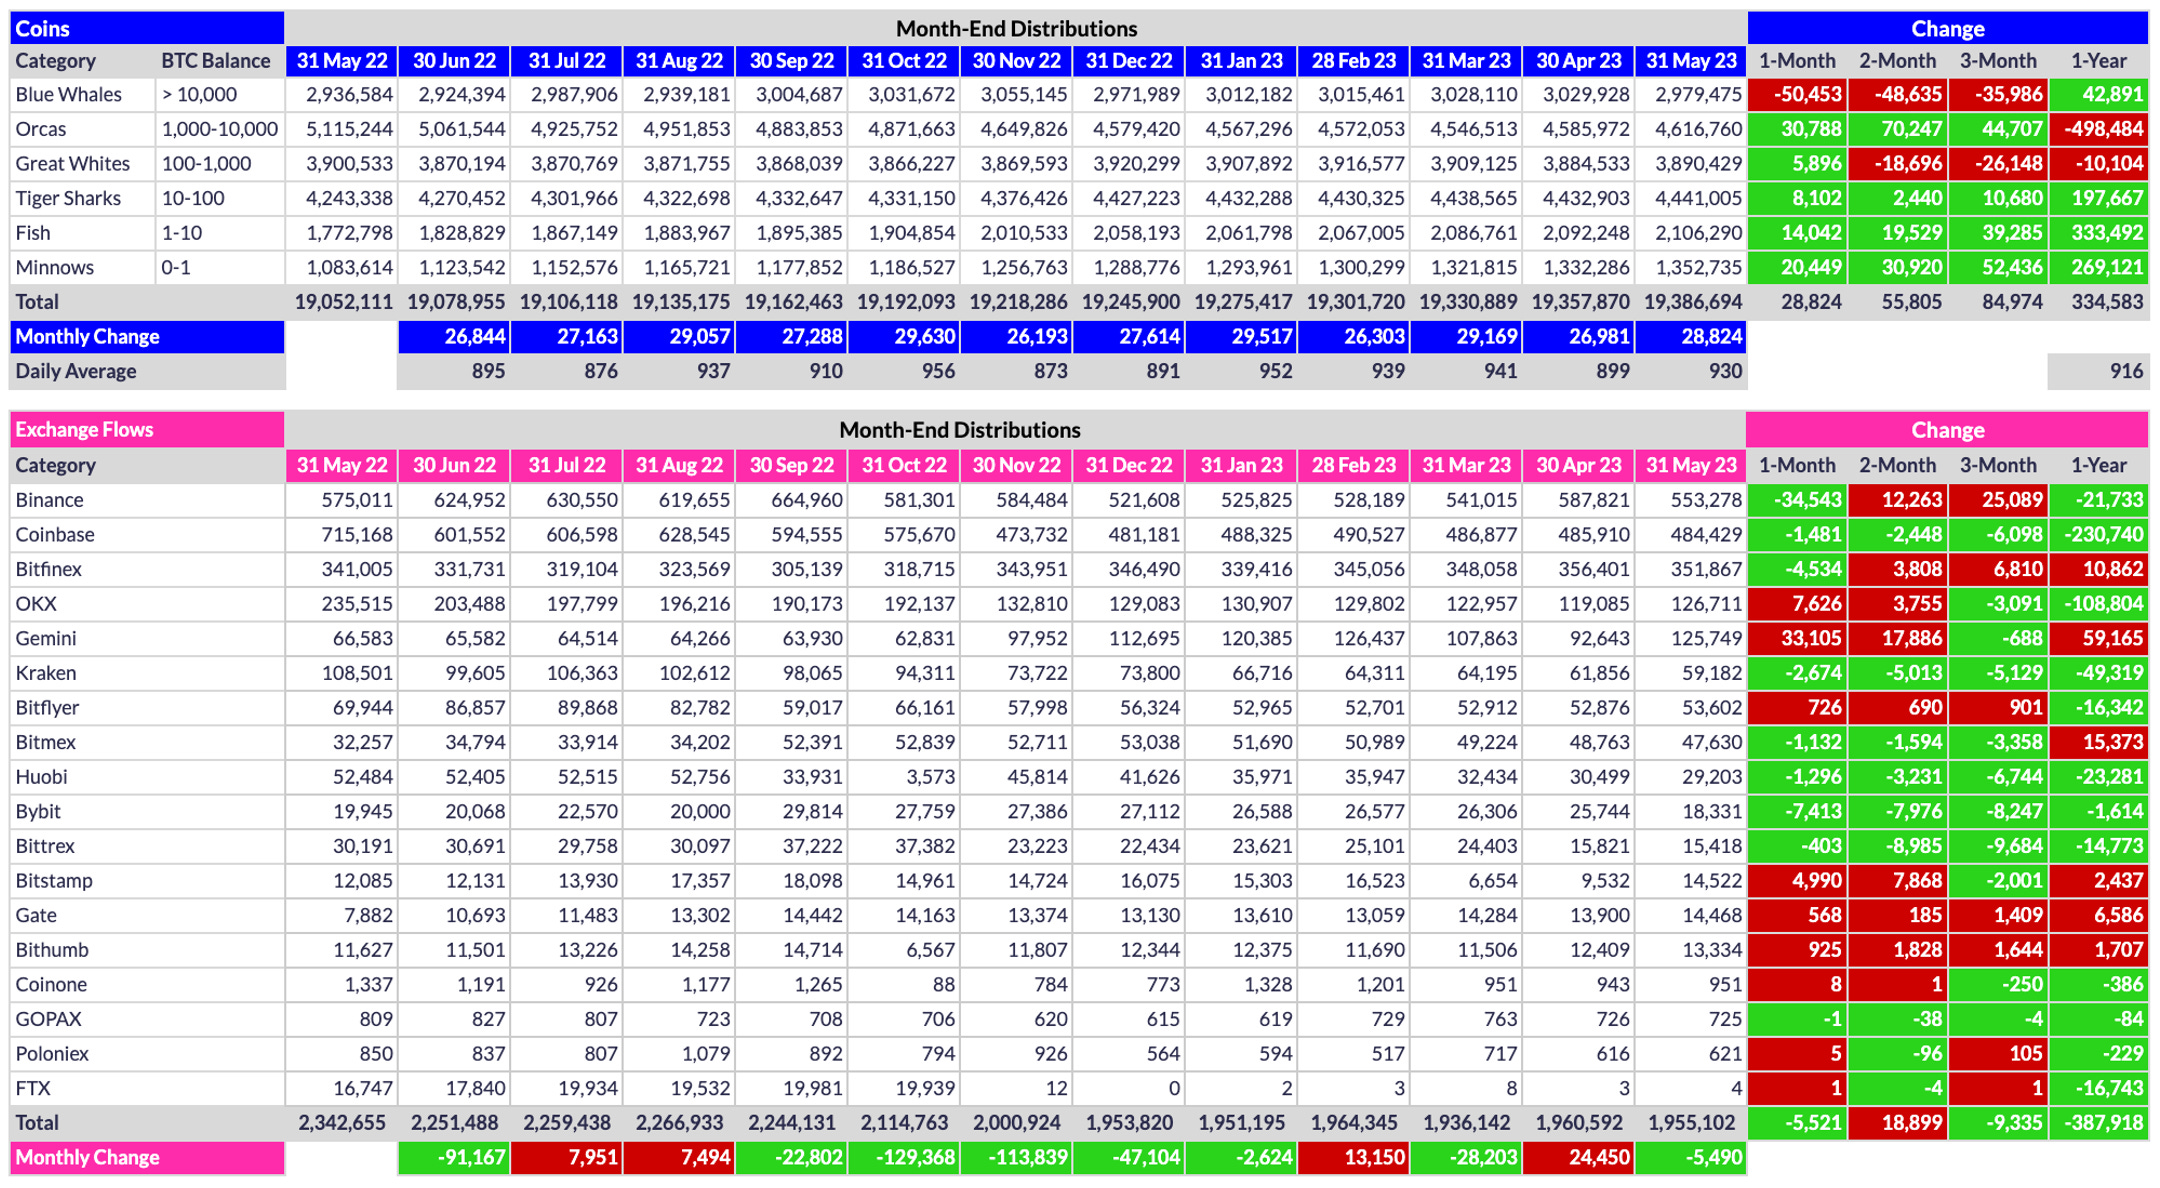
One of the most prominent data points above is the 50.5K coin-vomit by the Blue Whales (BWs). That said, Binance shed 34.5K coins during May, so a good chunk of the 50.5K coins shed by BWs can be attributed to this Binance outflow. On the other hand, Gemini had a net 33.1K inflow for the month, with a 38K inflow in particular occurring late on May 31. I haven’t had time to investigate the inflow to determine its source, but it is possible that some whale moved coins from Binance to Gemini, which if true, would result in a near-neutral exchange flow. This possibility is mere conjecture, however, because I simply have not had time to investigate.
Regardless, it is clear that retail buyers absorbed a lot of liquidity during May, to the tune of 34.5K coins (the combined net coin increase among Fish and Minnows). Moreover, exchanges experienced a combined net outflow for the month, albeit a modest 5.5K coins. Still, an impressive 388K coins have flowed out of exchanges over the past 12 months, which is spectacular. To put that number in perspective, exchanges would be devoid of coins in less than five years at this outflow pace. Maintaining this pace, however, is unlikely for a number of reasons, but it nevertheless reinforces the thesis that a supply squeeze of epic proportion will one day strike exchanges, even if the exact date of such a squeeze remains elusive.
Conclusion
As I stated last month, 2023 PA has thus far been in line with my expectations based on where BTC is in its halving cycle. We are in what I consider to be the early part of the (re)accumulation phase of the halving cycle, the 12-15 month period following the cycle low but before the next halving (which is projected to occur in April/May 2024). Now, after a modest pullback this May, I expect price to rebound in June. A lot? No. Volume is at historically low levels and institutional buyers, buyers who can both substantially and sustainably move price, are conspicuously absent from the market. Nevertheless, rallies do occur even when retail traders dominate the market, so that is what I expect - a modest rally in June. On the other hand, a second consecutive down month during the (re)accumulation phase of the halving cycle would not be unprecedented. Regardless of June PA per se, my conviction that sub-$20K is permanently in the rearview mirror is MUCH higher now, bordering on near certainty, at least short of a global macroeconomic cataclysm. Nevertheless, I have learned through hard-earned experience that anything is possible in Bitcoinistan. ANYTHING. But that’s what makes investing in the corn so darn addictive, no?
Go #BTC.