
Month-End Analysis

Disclaimer
The data I use (BitInfoCharts, Coinglass, CoinMarketCap) to compile the tables and graphs contained in the on-chain section of this analysis do not always align with data found via others sources like Glassnode and CryptoQuant. I cannot explain the reason for the differences nor can I confirm which sources are most accurate. For this and other reasons, I have come to trust only the on-chain data I collect when trying to explain and/or predict Bitcoin’s (BTC) future price action (PA). Whether you too find my on-chain analysis useful is for you to decide, but I can assure you that some of my observations and/or predictions will differ, often markedly, from other observations and/or predictions you will see on Crypto Twitter (CT) and elsewhere.
Price Action
July PA was another roller-coaster ride, with price opening at $30,475 (on BLX), rising to a high of $31,800 on July 13 upon news that XRP won (in part) its lawsuit with the SEC, only to faceplant the very next day, sliding all the way back down to a low of $28,890 on July 24, before finally closing the month at $29,235. When all was said and done, price closed 4.07% lower for the month.
Below are the calendar-month returns for BTC throughout its history:

As shown above, July was only the second month this year that BTC’s price closed lower, but also as shown, July counter-traded June for the sixth consecutive year and the 10th time in BTC’s 13-year history. When combined with calendar-month returns reorganized according to the three phases of the halving cycle that I have identified, there is a reason I predicted last month that July would close lower.
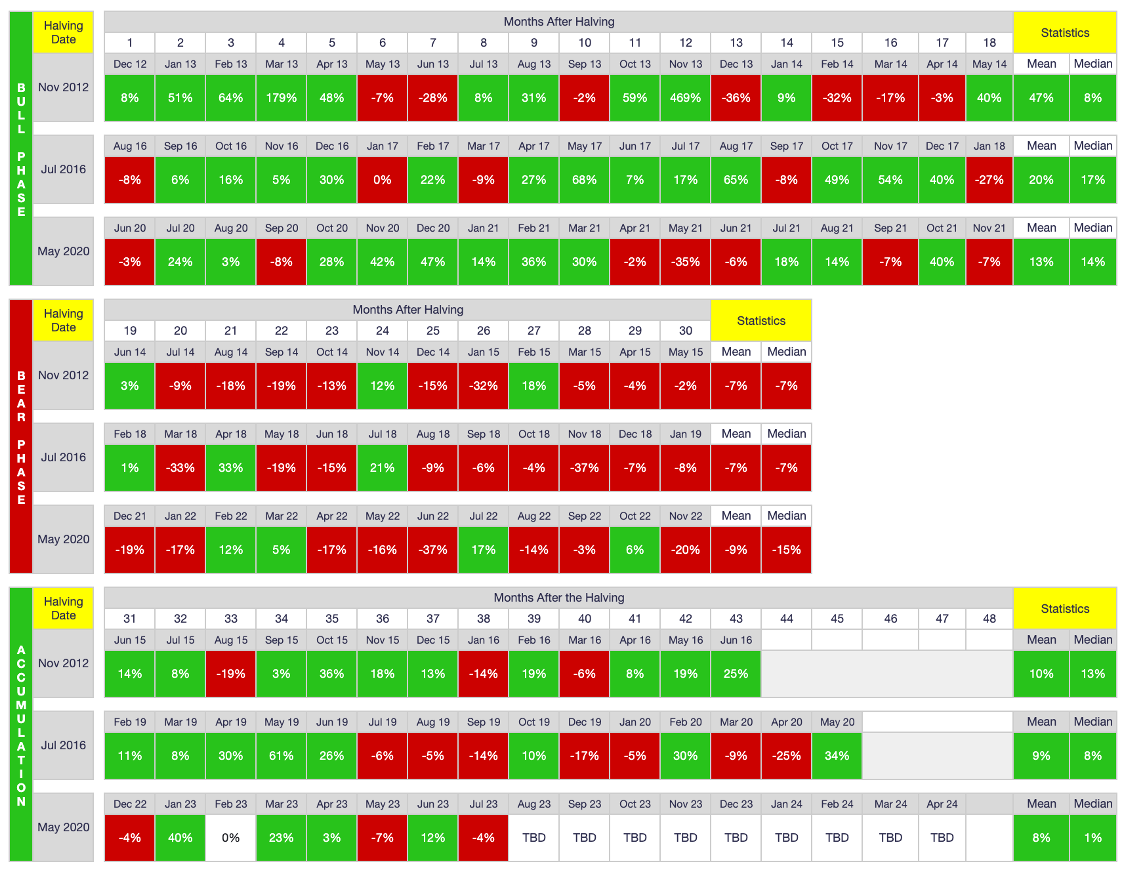
As shown above, the accumulation phase of each halving cycle (the lower portion of the three-phase table) experiences a combination of up months and down months but with the overall trend being higher. Because 2023 has already been a robust year, combined with the seemingly inexplicable trend of June and July counter-trading each other, July seemed almost predestined to close lower. And for those keeping score at home, my July prediction is now the third consecutive month I have been correct in terms of directional PA (having also correctly predicted a lower May and higher June).
Of course, my predictive success is not because I am some sort of savant and most certainly not because of my use of technical analysis (TA); it is merely because BTC PA is behaving exactly as it has for its entire existence. i.e., While I cannot prove causation, there is clear and abundant evidence of correlation, meaning there seems to be a very predictable rhythm to each halving cycle. As shown above, we are in what I call the accumulation phase of the cycle, which starts about 30 months after the previous halving and lasts about 15-17 months, leading into the next halving. August 2023 will be the 39th month of this halving cycle, which is smack-dab in the middle of the accumulation phase, ninth months after the bear phase of the cycle and nine months before the next halving (projected to occur in April 2024).
In fact, given where we are in the halving cycle and based on July’s PA, I actually expect August to be a rebound month for BTC despite the fact that it is off to a dreadful start, with price already struggling to hold $29K (I am writing this analysis on the morning of August 4).
I in fact made my August 2023 prediction over a month ago and see no reason to abandon it now despite the difficult start to the month:
…More specifically, I think July will print red, August will print green and September will print red, with Q3 closing lower overall.
Again, my “predictions” (aka, guesses, because let’s face it, that’s what they are) are based solely on the rhythm of the halving cycle, but so far, that rhythm indisputably holds. Will I be correct four months in a row? Let’s hope so, because Septembers are far and away the worst performing calendar month throughout BTC’s history.
On-Chain Data
Below are the distribution of addresses and coins for the past 12 months.

As shown above, whales in particular have been devolving at an alarming rate. One Blue Whale (BW) and 24 Orcas devolved in July alone, and seven BWs have devolved in the past three months. Those who have followed me for any length of time know that I think whale-address trends, and Orca trends in particular, reliably foretell PA, if not on a daily or weekly basis, then certainly over time. I have demonstrated support for this belief here and here. To this end, there is reason to be bearish in the near term:
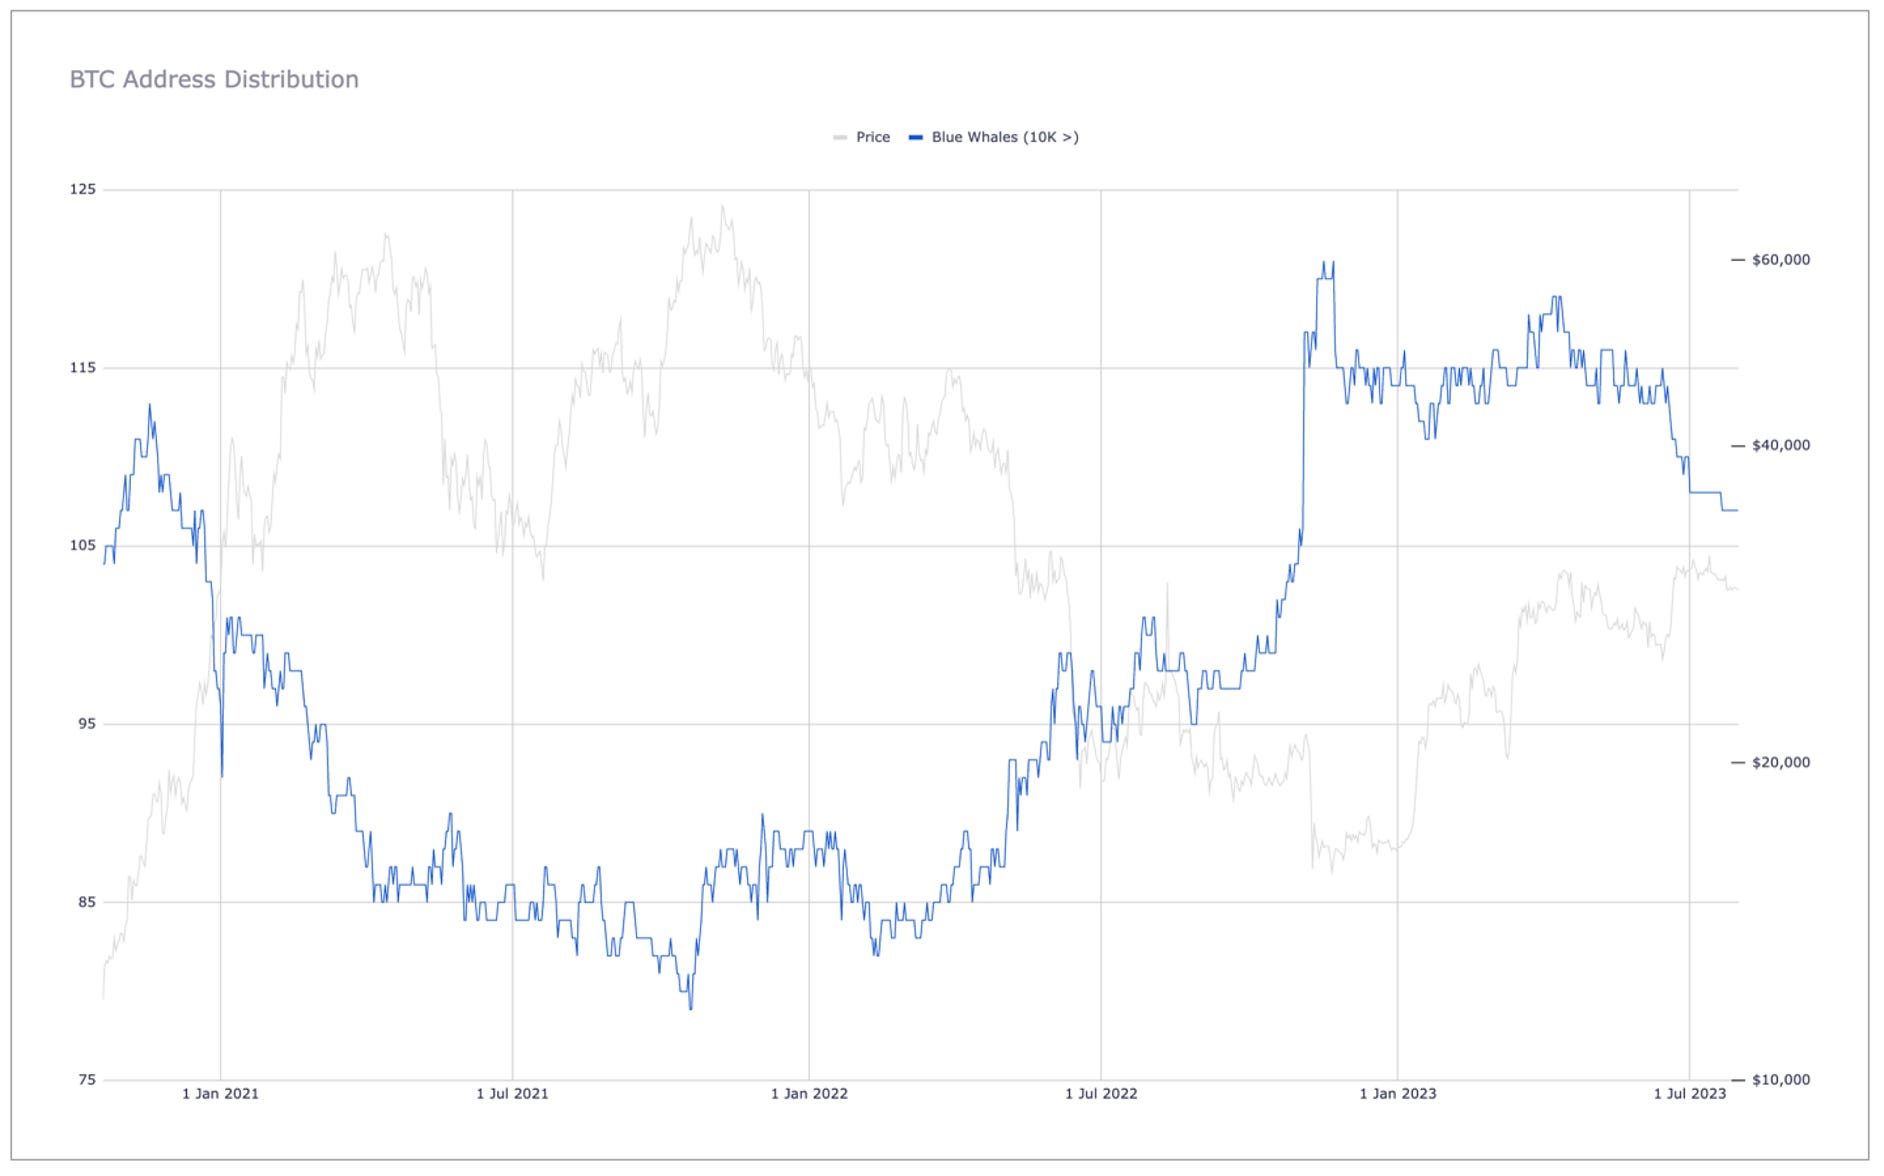
As shown above, the contraction of BW addresses has been pretty pronounced of late. That said, and despite the devolution of 24 Orcas in July alone, the Orca trend throughout 2023 remains fairly stable/neutral overall:
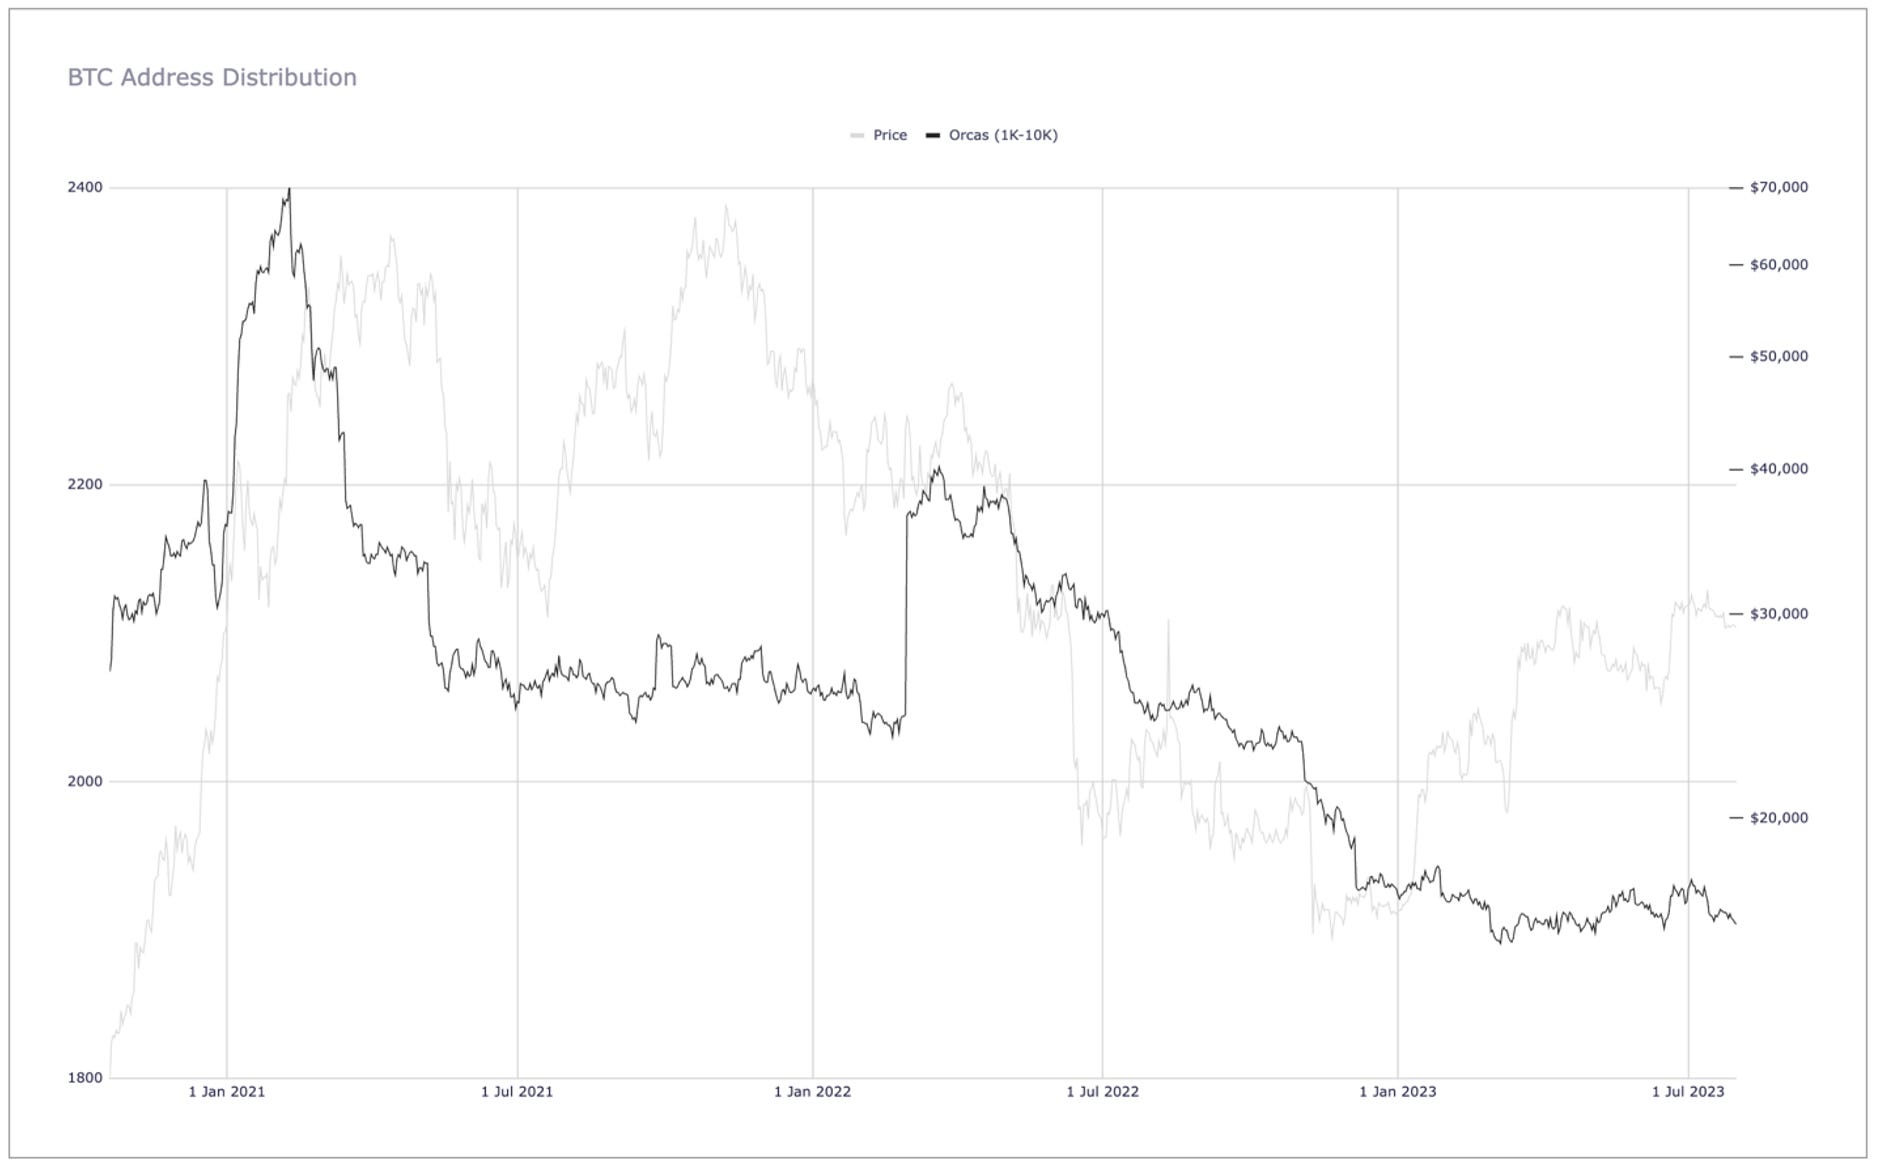
To this end, and as I have explained many times before, Orca counts need not only stabilize but actually start increasing in number before we longs can expect a sizable and sustainable increase in price. That said, and as shown once again below, retail buyers continue joining the network exponentially, seemingly irrespective of PA.
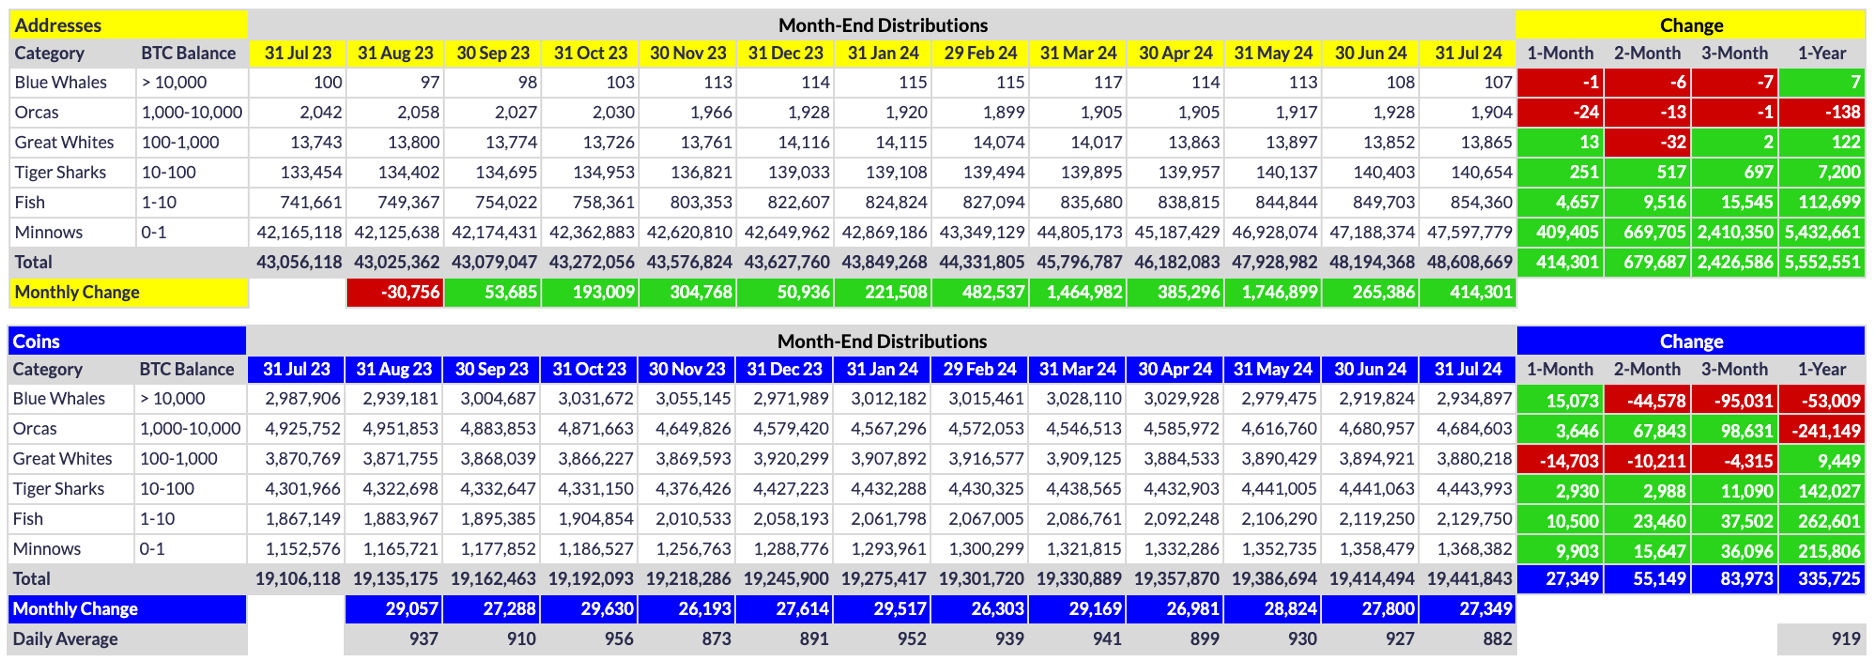
As shown above, not only did a combined 415K retail buyers (Minnows and Fish) join the network in July, they added an astounding 20.4K coins to their collective stockpile, amounting to 75% of the new coins mined in July. As I have explained repeatedly, however, retail buyers simply lack the purchasing power to move price meaningfully other than in short/temporary bursts (e.g., like when the XRP lawsuit outcome was announced). But for those who own BTC for reasons other than only price appreciation, to see the network add literally hundreds of thousands of new users virtually every single month is not only awe-inspiring but conviction-boosting: BTC is here to stay no matter what even the most ardent naysayers claim. The only question is whether/when it becomes the basis of the next global financial system following the seemingly inevitable collapse of the current fiat-based system.
One other encouraging highlight in the data above: despite the devolution of 25 whales in July, their tiers actually added 18.7K coins to their collective stockpile. That said, the BW coin-gain did include a net exchange inflow in July:

As shown above, Binance and Bitfinex alone experienced an inflow of 67.6K coins, which more than offset the nearly equally impressive 55.4K outflow experienced by Coinbase and Gemini. Overall, exchanges had a net inflow of 12.6K coins in July, the first net inflow since April. This inflow offsets about 80% of the 15.1K gain that BWs experienced in July (as several BW wallets have been identified as exchange wallets). Still, non-exchange whales net-added 6.0K coins to their stockpile, which illustrates the conviction that most large investors have despite several large traders continually hopping in and out of the market with every meaningful move in price.
Conclusion
Despite the anticipated pullback in July, it is important not to lose sight of the bigger picture. Pricewise, BTC is still up an impressive 76.4% year-to-date and 83.7% from the cycle low set last November (following the FTX collapse). As such, while we longs greatly look forward to the time when $30K holds as support forever-more, we need to remember that we are still in the accumulation phase of the halving cycle, meaning there will be both up months and down months leading into the next halving. In this vein, I do expect August to be a rebound month for BTC despite its rough start, given July’s downward PA and its location within the halving cycle. Nevertheless, I expect Q3 to be down overall, especially given how awful Septembers usually are for the corn (and many other markets), so expect a bumpy few months ahead, especially with such a tremendous gain the first half of this year. Regardless, most of us know by now that the only constant in Bitcoinistan is change. Anything can - and often does - reverse market sentiment in an instant. Whether it be an exchange collapse or a US spot-BTC ETF application, the only constant in Bitcoinistan is change. Well, that and MSTR 0.00%↑ figuring out a new way to add to their stack. ;-)
Go #BTC.