
Month-End Analysis

Disclaimer
The data I use (BitInfoCharts, Coinglass, CoinMarketCap) to compile the tables and graphs contained in the on-chain section of this analysis do not always align with data found via others sources like Glassnode and CryptoQuant. I cannot explain the reason for the differences nor can I confirm which sources are most accurate. For this and other reasons, I have come to trust only the on-chain data I collect when trying to explain and/or predict Bitcoin’s (BTC) future price action (PA). Whether you too find my on-chain analysis useful is for you to decide, but I can assure you that some of my observations and/or predictions will differ, often markedly, from other observations and/or predictions you will see on Crypto Twitter (CT) and elsewhere.
Price Action
June PA was quite the roller-coaster ride, with price opening at $27,222 (on BLX), cratering to a low of $24,750 following the US Securities and Exchange Commission (SEC) lawsuits against Binance and Coinbase as well as their declaration of a number of alt coins being securities, and then rebounding to a monthly high of $31,444 after BlackRock submitted their application for a spot-BTC Exchange Traded Fund (ETF). By the time the dust settled, June closed up 11.92% at $30,467.
Below are the calendar-month returns for BTC throughout its history:

As shown above, June 2023’s positive return bucks a recent trend of lower June prices, with the three previous Junes closing lower before this year’s 12% gain. As I often state, however, the location of the month within the 4-year halving cycle seems far more important than the calendar month per se.
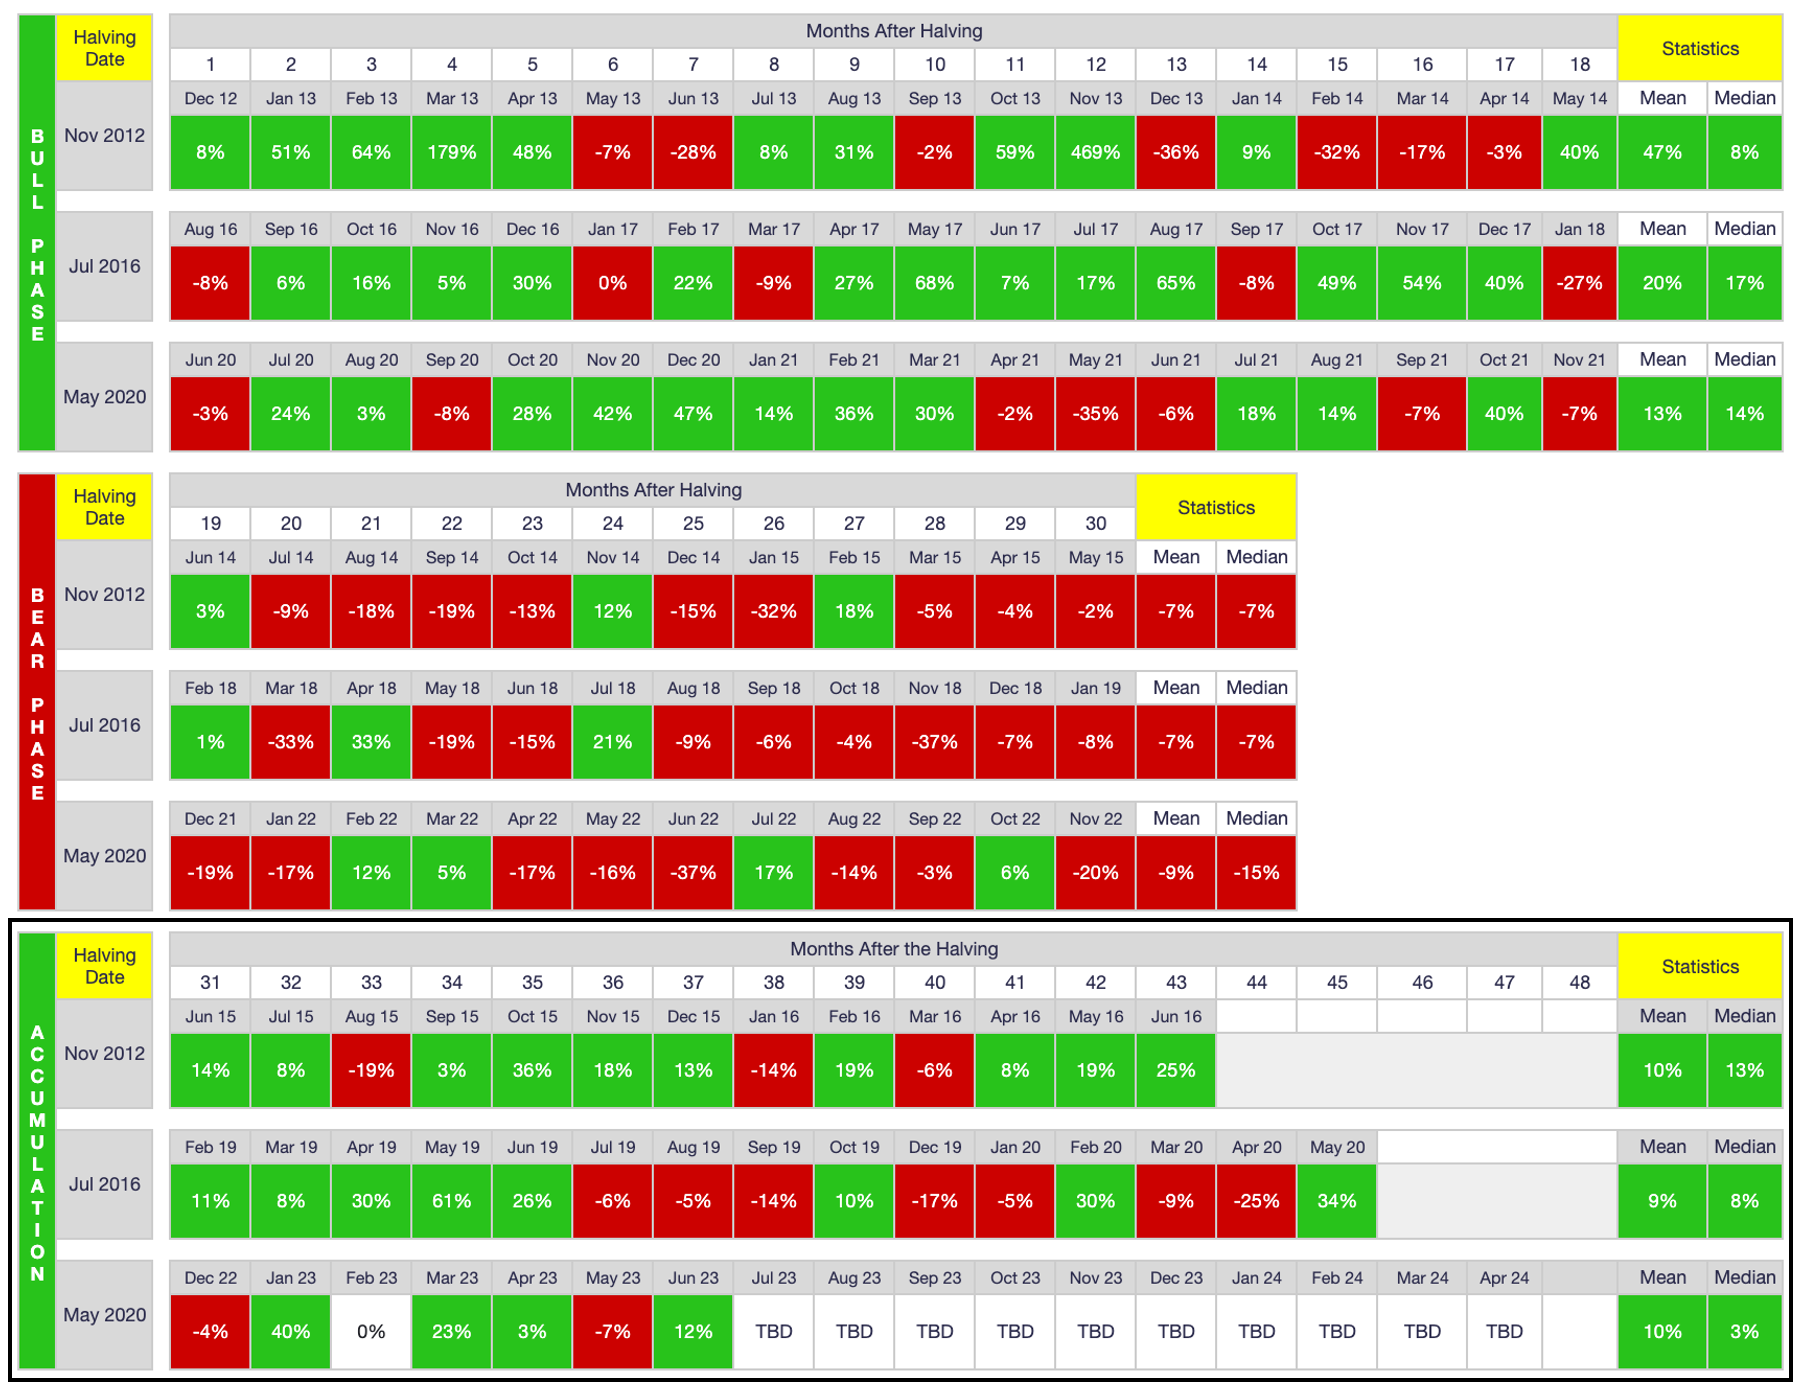
As shown above, with calendar months reorganized by halving cycle, June 2023 was the 37th month of this halving cycle and the seventh month of what I call the (re)accumulation phase of the cycle. Because the (re)accumulation phase typically experiences a recovery in price following the cycle low, calendar months during this phase print green more often than not (though not exclusively so). Hence the reason I predicted last month that June 2023 would be a green month:
…it could be argued that June 2023 will be a down month given that it has been the previous three years. However, I personally think this trend will reverse this year, principally because I have more confidence in the rhythm of the halving cycles than I do in calendar-month predictions per se. Time will tell of course, and no one should make any investment decisions based on my “predictions,” but I do think June will be a bounce-back month after the modest decline in May.
So, will July 2023 also be an up month following the same logic? I of course have no idea, but if I had to bet, I would bet no, actually. i.e., I think July 2023 will be a down month, and for a couple of arguably hypocritical reasons, because I am basing my prediction on calendar trends rather than halving-cycle trends, as shown below:

First, note the June-July relationship above. As shown, July PA has printed opposite June the past five years, six of the past seven years and nine of the past 12 years. For whatever reason, July usually countertrades June. Does this mean July 2023 must print lower? Of course not. Anything can happen within crypto (or more broadly the global-macro environment) that would send price hurtling in one direction or the other, just as is the case every month. In this light, June 2023 clearly would have ended lower had BlackRock not submitted their ETF application. Likewise, price likely wouldn’t have collapsed below $25K in the first place had the SEC not sued Binance and Coinbase among other things. Nevertheless, the longer I study BTC PA, the more I have come to accept that something is ALWAYS happening in the market, so there is merit in stepping back to just look at past data to see where BTC may be headed in the future. Put another way, while past performance is no guarantee of future performance, BTC PA continues to conform to a cyclical pattern for whatever reason, whether causal or coincidental. For this reason, I continue relying on this trend to tell me where price is headed almost irrespective of any one global-macro/crypto-specific news event, particularly because we can never foresee when such events will occur.
To that end, below is another reason I think July 2023 will close lower:
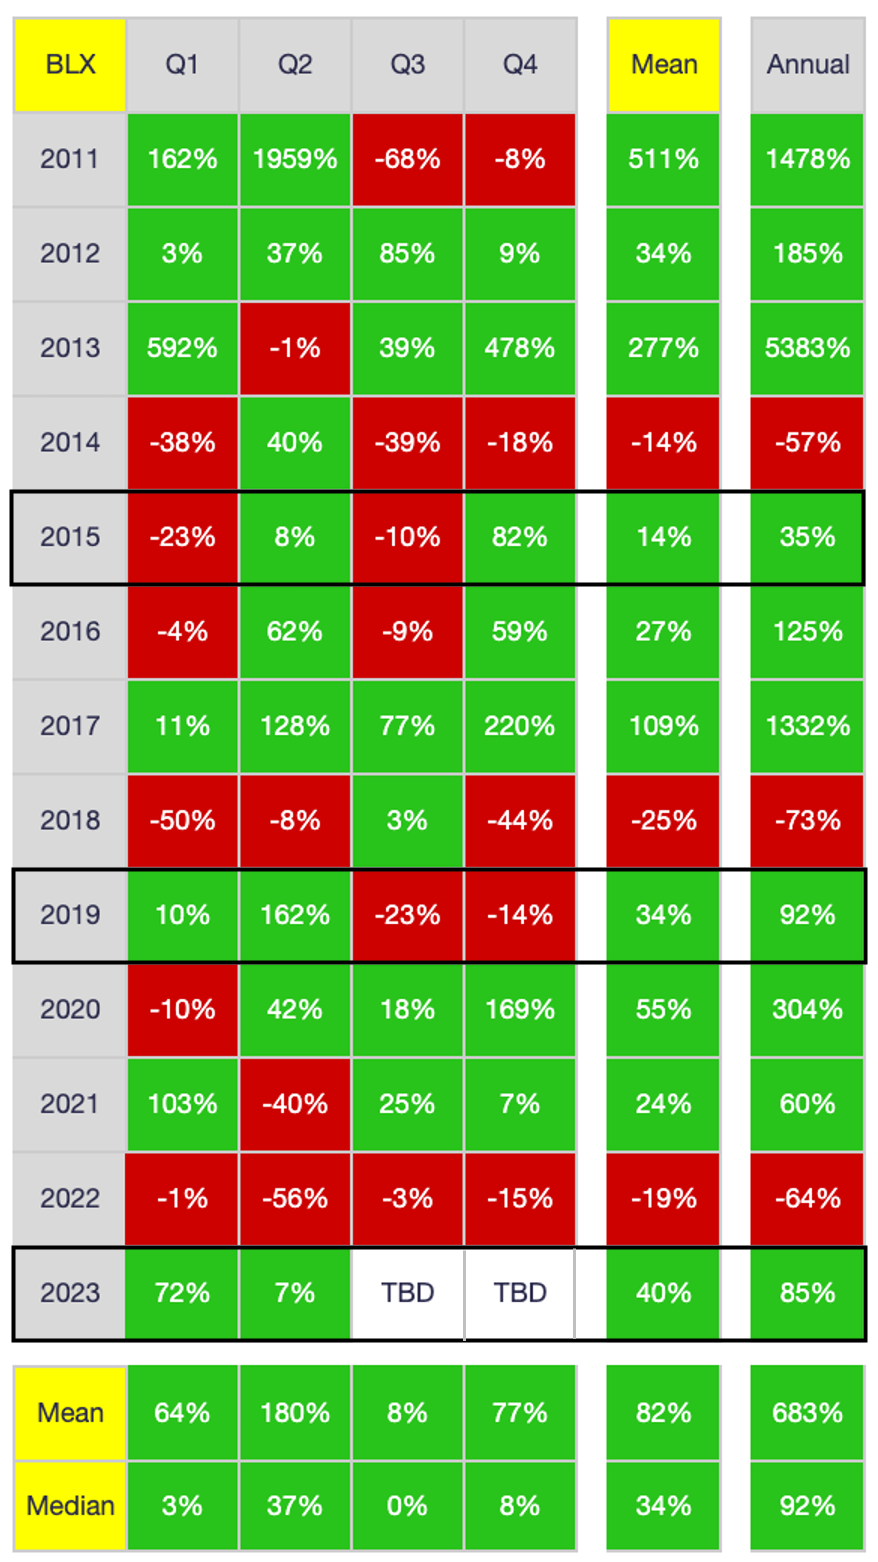
As shown above, the years immediately following red years (2015 and 2019) printed two up quarters and two down quarters (albeit different quarters). Given that 2023 also follows a red year (2022) and the first two quarters of 2023 have already printed green, it seems more likely than not that Q3 2023 will print red as well as possibly Q4 2023. Put another way, price is already up an incredible 85% this year. As such, a pullback seems more likely than not, particularly because the next halving is still nine months away. i.e., 2023 is not part of the bull phase of the four-year cycle; it is part of the (re)accumulation phase, which, while typically more bullish than bearish, is not straight bullish. At least not according to the PA of the previous two halving cycles.
Further reinforcing my belief that at least Q3 will print red is that September is the final month of the quarter and September almost always prints red:
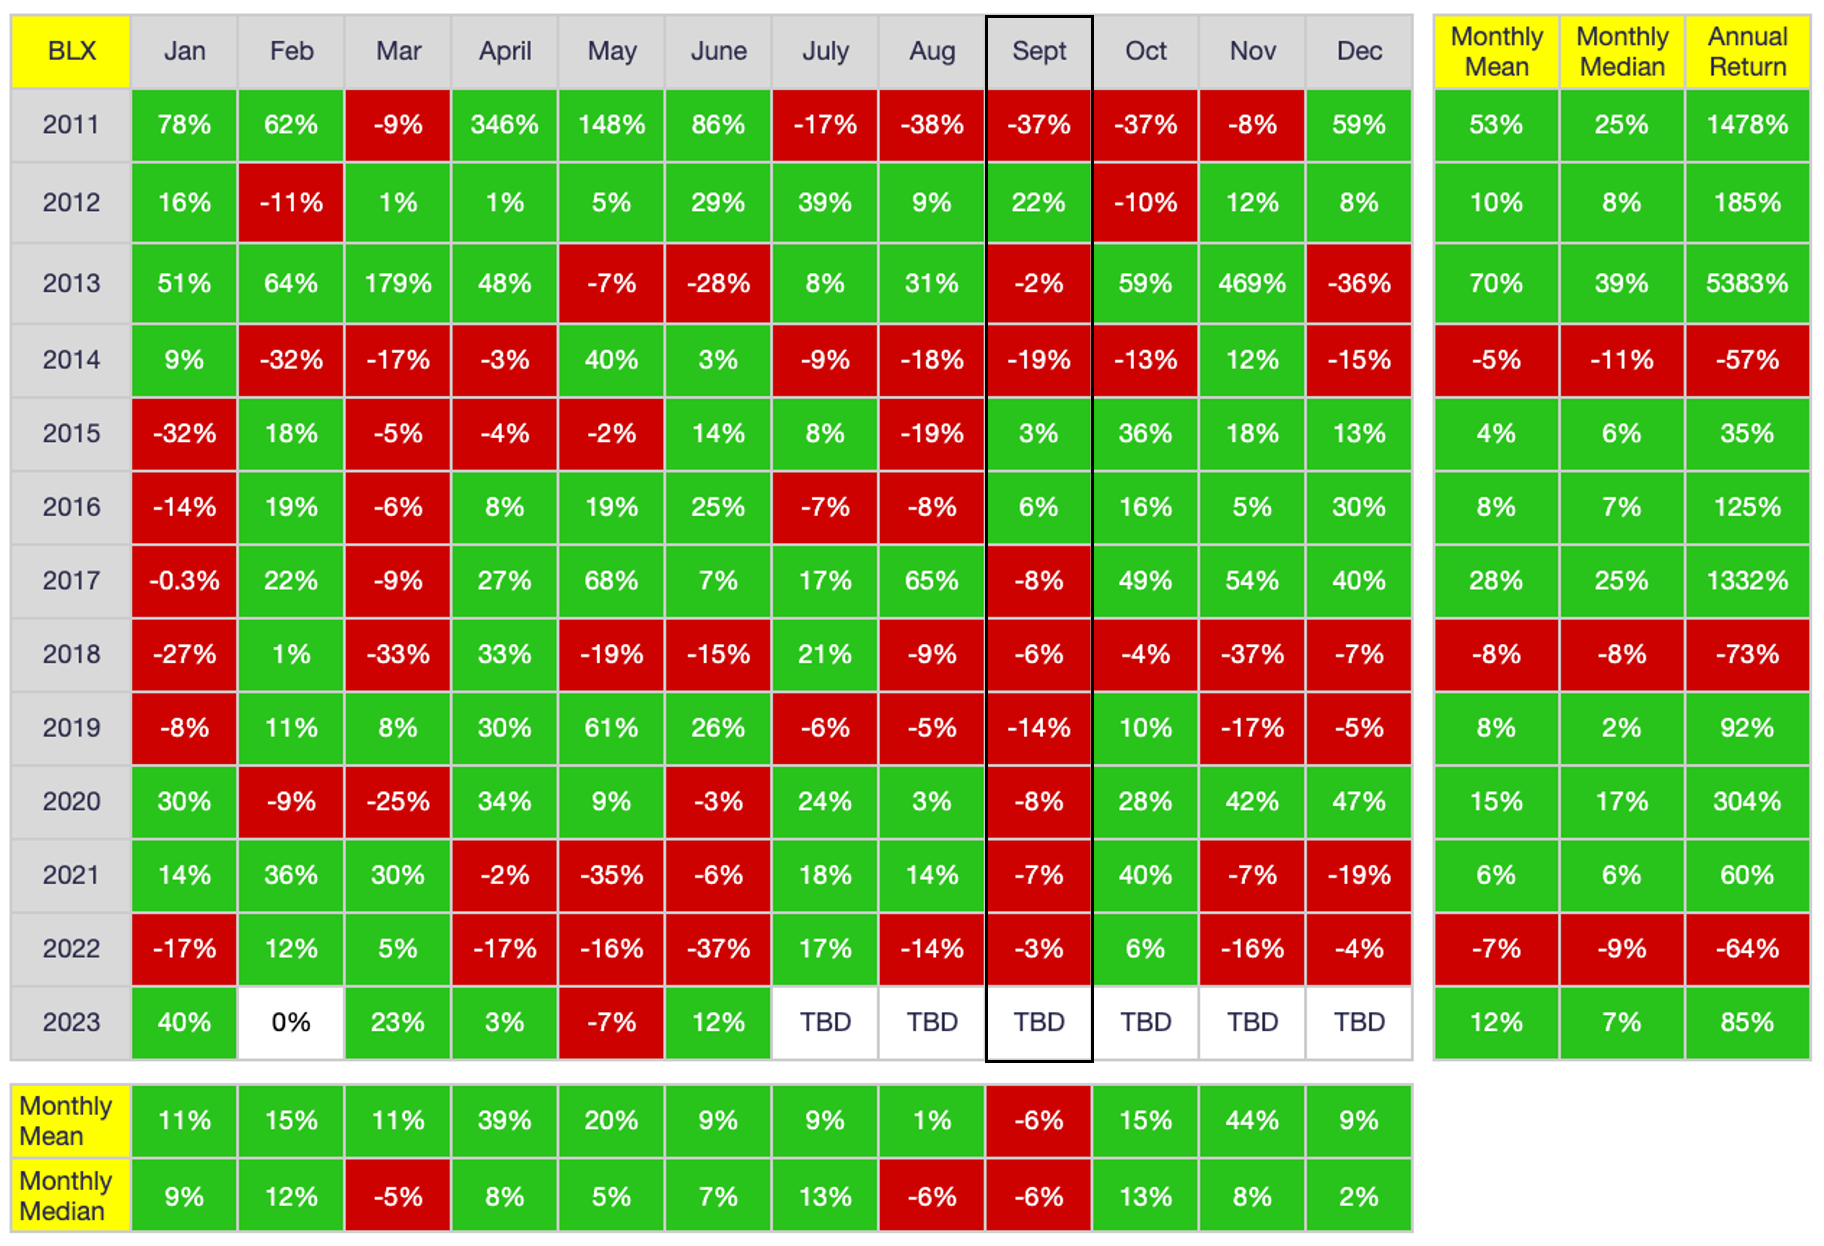
As shown above, September has printed red every year since 2017 and nine of the past 12 years. Combine this fact with BTC’s quarterly performance and it seems likely that Q3 2023 will be a down quarter. More specifically, I think July will print red, August will print green and September will print red, with Q3 closing lower overall.
All this said, if Gary Gensler was indeed fired and/or if a spot-BTC ETF application gets approved, all bets are off. I’ll see you on the moon. Then again, either/both of these things could happen and, e.g., there could still be a global-macro meltdown of some sort thereafter, which would cause price to swoon just as quickly. Who knows. No one, in fact, knows, as I often point out. Anyway, I would love to be proven wrong, but I expect July to close lower. Not deeply lower necessarily, but lower indeed.
That said, let me share some eye candy so I can conclude this section on a more positive note:
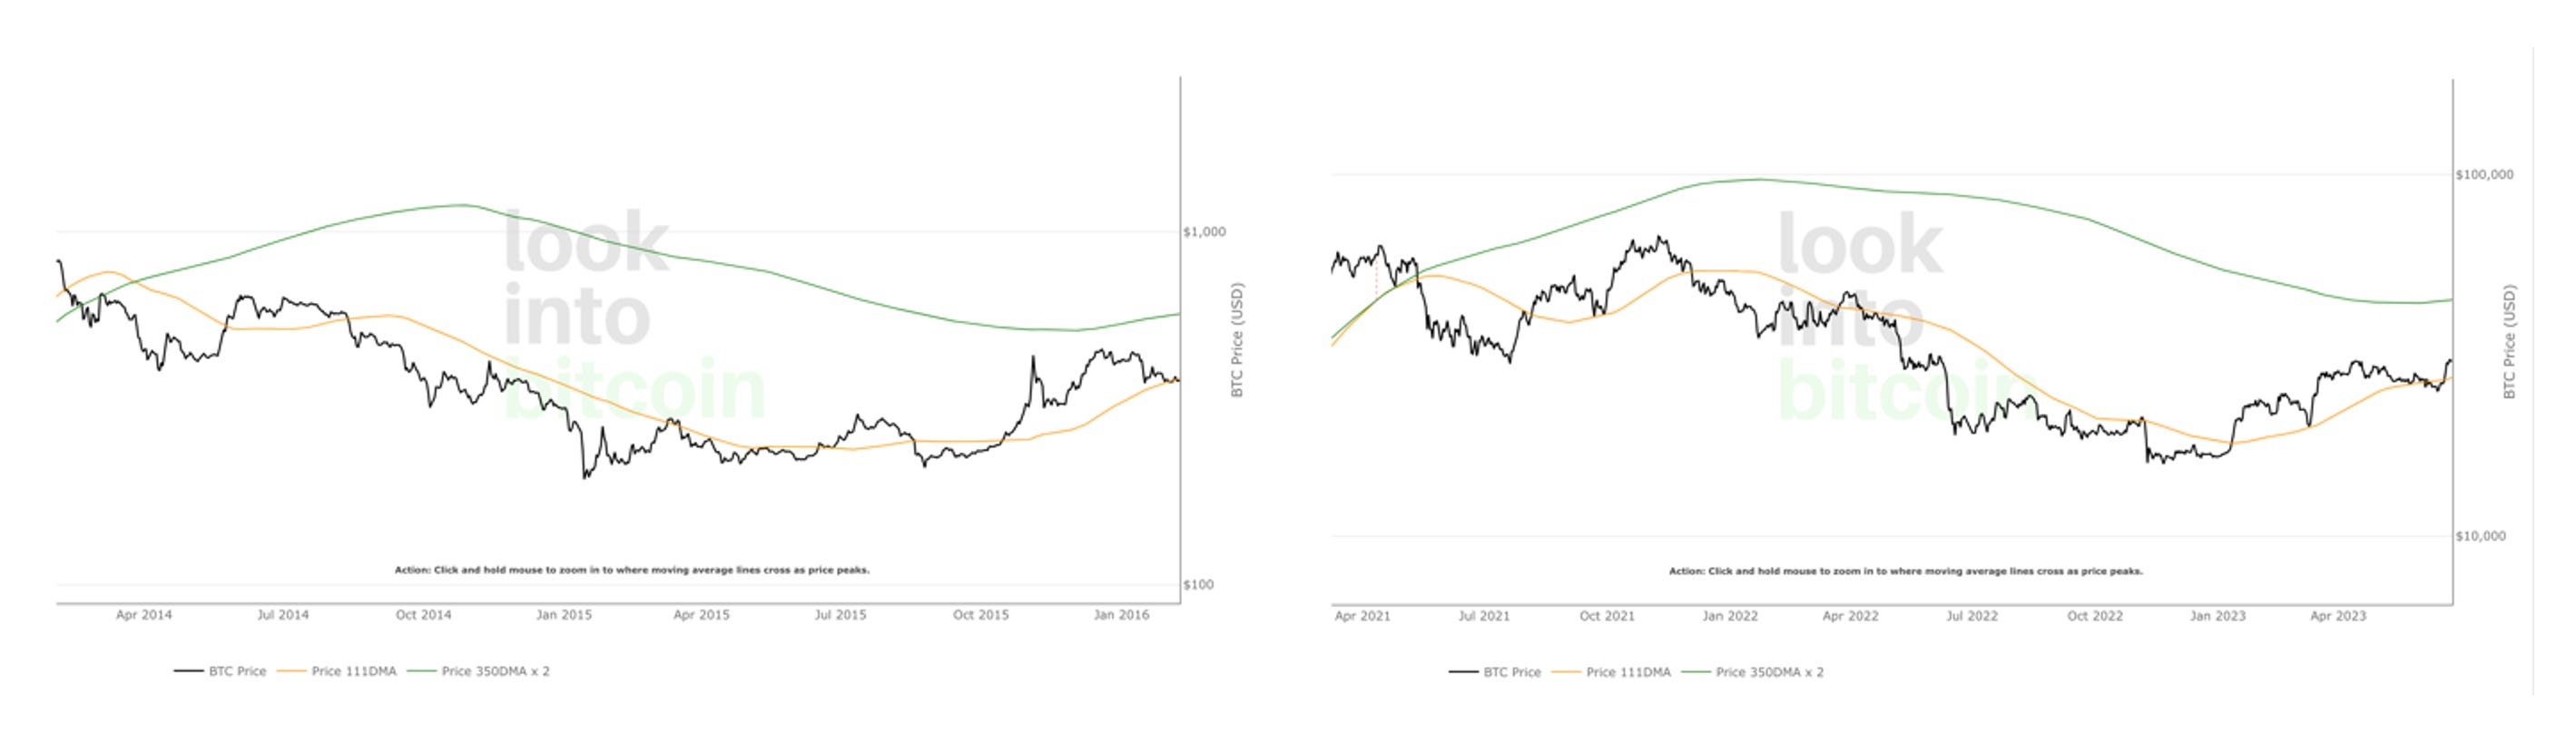
The charts excerpts above are from the Pi Cycle Top Indicator. I juxtaposed these excerpts to illustrate just how similar the 2012 and 2020 halving cycles have unfolded post peak. It is almost surreal how similar the bear phases of these two cycles have been. So why am I sharing this fractal? To remind everyone what happened in 2017 and thus what could happen in 2024 as a result:
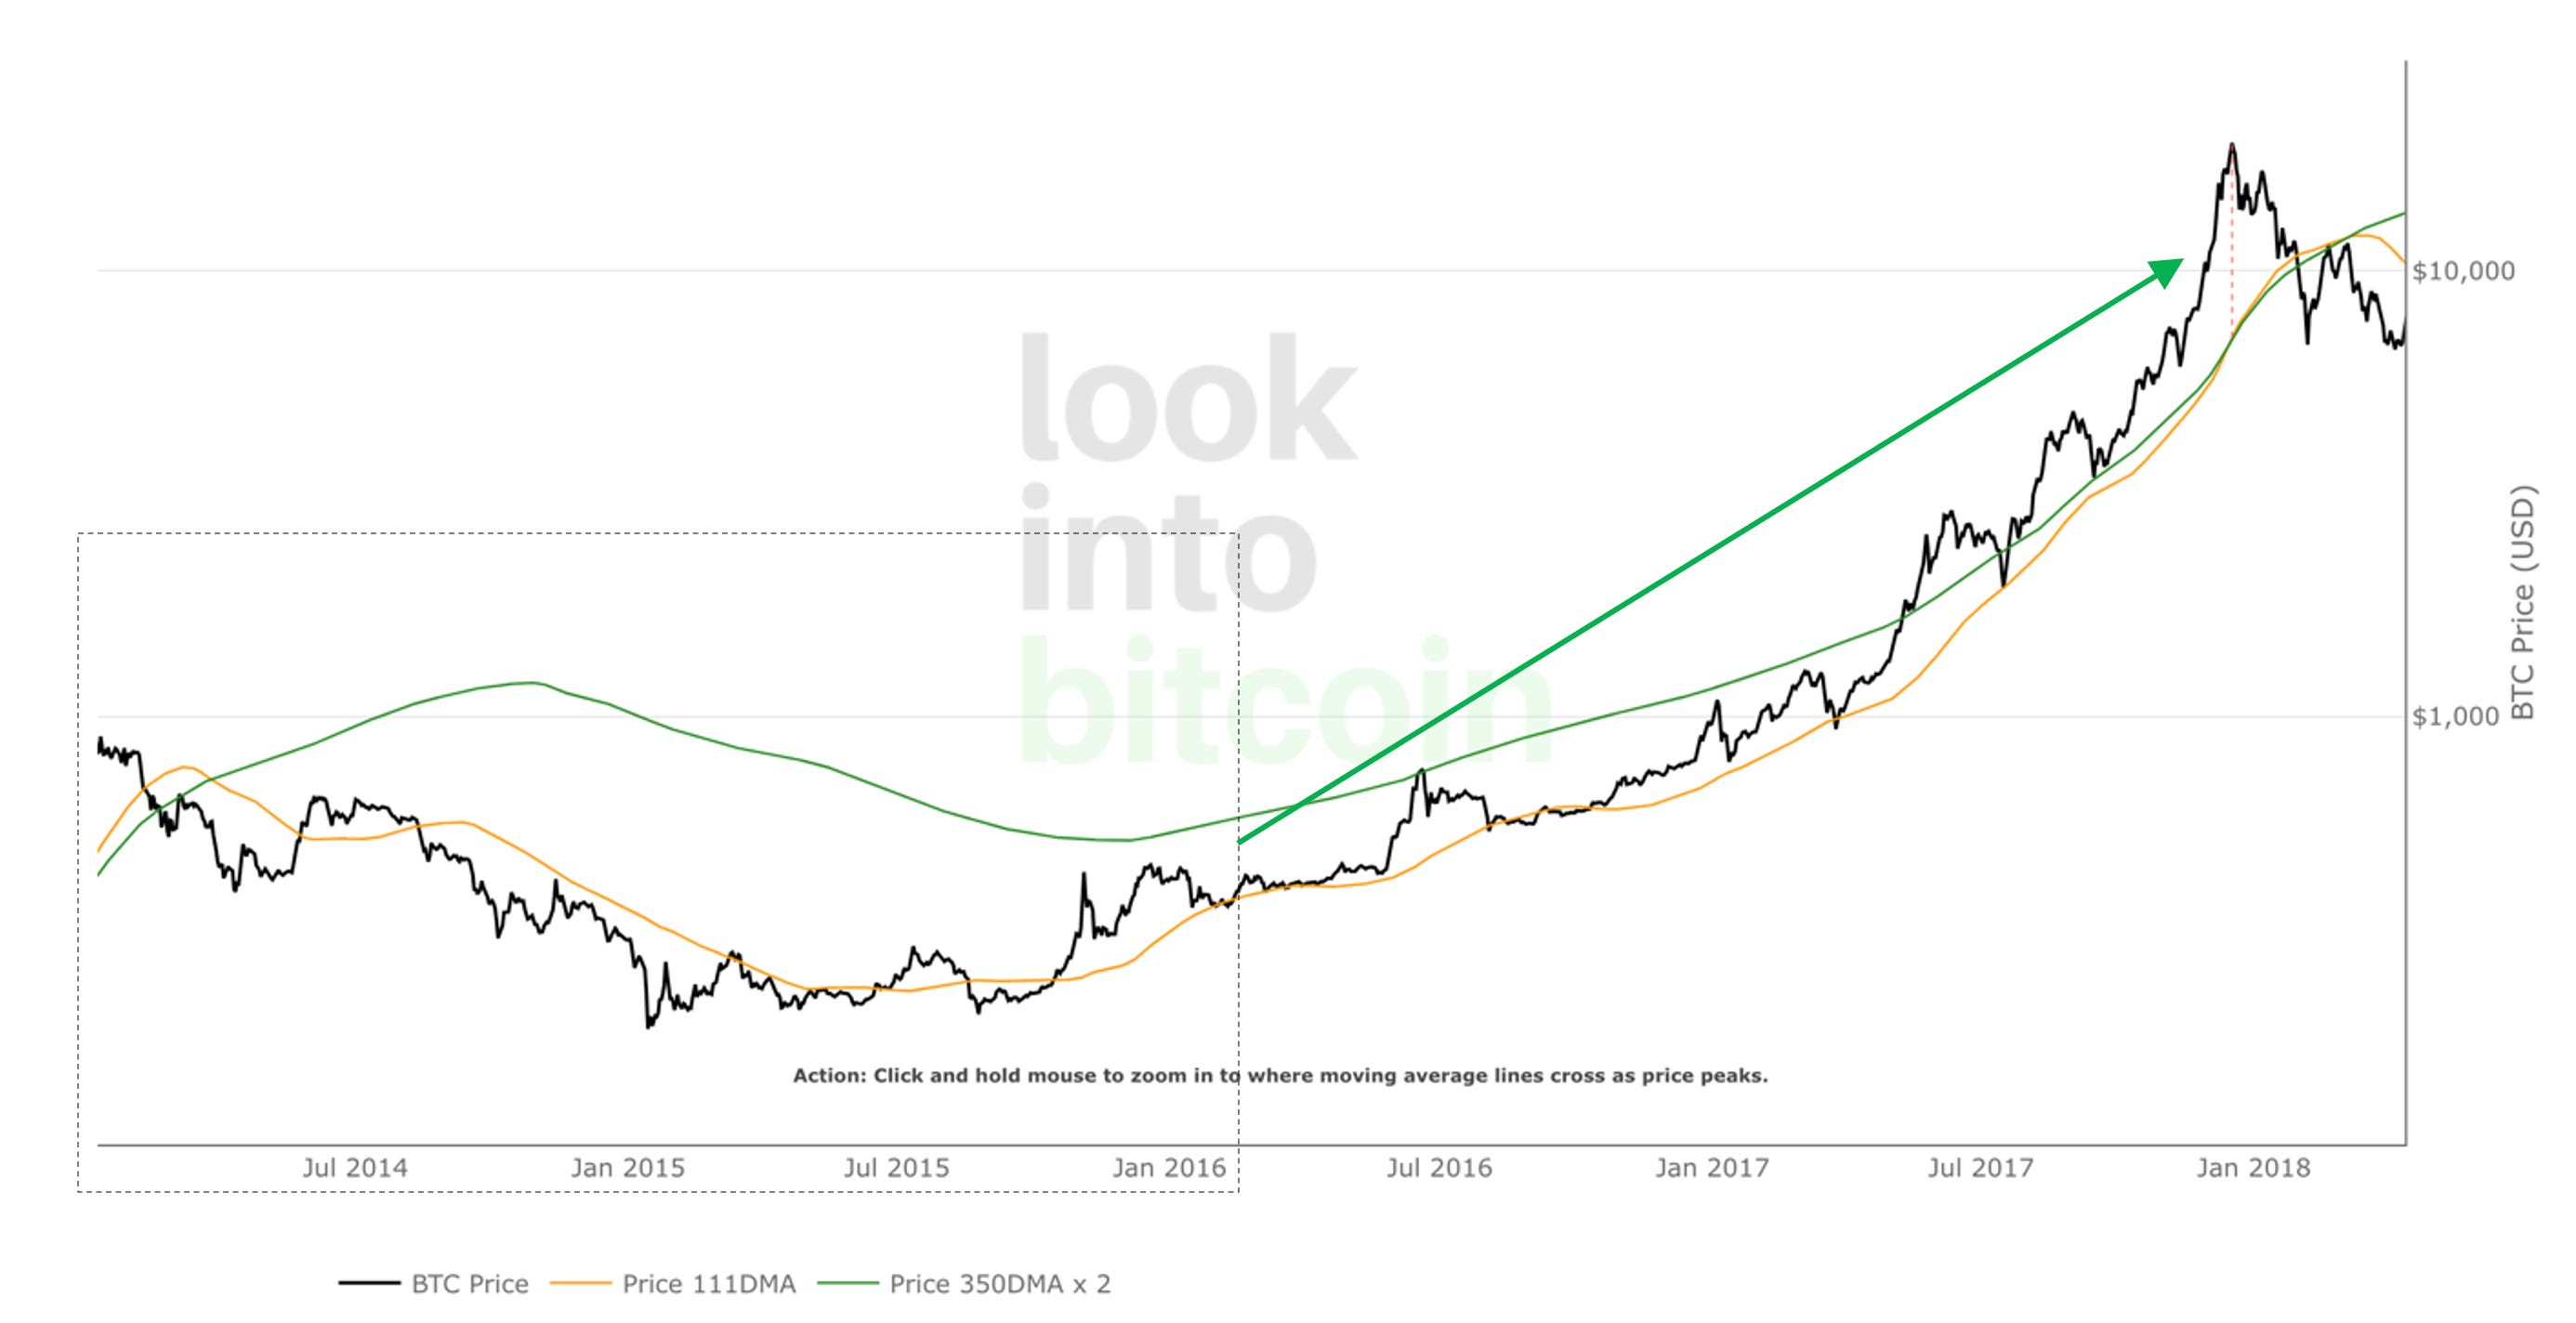
The dotted rectangle in the chart immediately above is the chart excerpt depicted further above, with the rest of the chart portrayed to remind everyone just how insanely bullish PA was thereafter, straight through December 2017. There is no reason to think the next 18 months will not unfold in a similar manner. Or stated more strongly, there is every reason to think the next 18 months will unfold similarly until/unless there is clear evidence that the rhythm of the four-year halving cycle has broken down. The trend is our friend until the end, right? I certainly think so.
On-Chain Data
Below are the distribution of addresses and coins for the past 12 months.

As shown above, retail network adoption continued growing at an exponential rate in June, just as it has for virtually every month for the past year. Another 265K Minnows and Fish joined the network in June, adding an astounding 18.7K coins to their stacks during that time. That said, we should not overlook the loss of five non-exchange Blue Whales in June, which makes six in the past two months and nine in the past three.
In one respect, it could be argued that the addition of 11 Orcas in June and 23 over the past two/three months offsets the BW devolution, particularly because their net-coin gain exceeds that of the BWs’ net-coin loss. Fair point. i.e., It is possible that one or more BWs merely split their stockpiles into smaller piles. That said, my concern can be more easily understood visually:
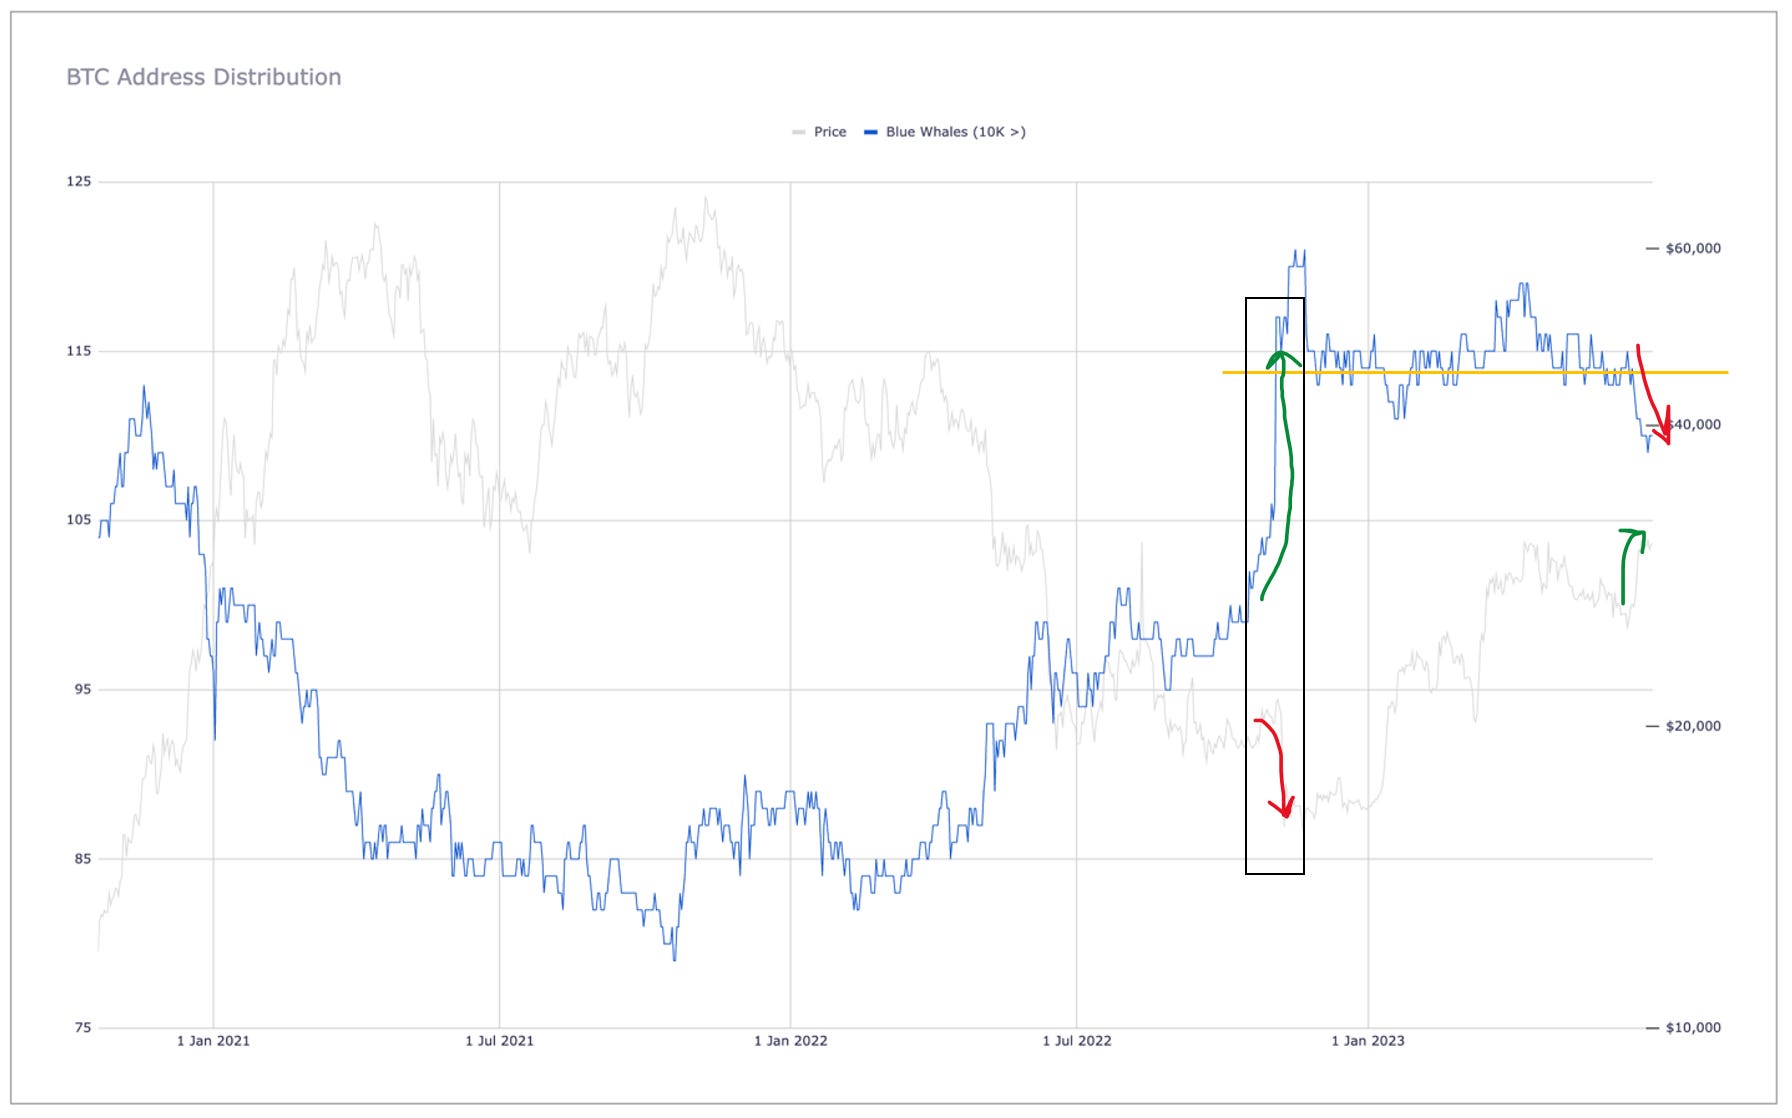
As shown above, there was a massive influx of BWs in November 2022, right after the FTX collapse, which in hindsight was a brilliant decision, reinforcing the stereotype that so-called smart money knows when to buy and sell. More broadly, it should be visually apparent above that BWs have typically bought during swoons and sold during pumps throughout this halving cycle, with their trend lines continually moving in opposite directions. If so, it is clear that the trendline at the top right of the graph has broken down. BW numbers had achieved equilibrium at/near 114 between December 2022 and May 2023 after peaking at 121 on November 22, 2022. This is the reason I personally am somewhat concerned now. Combined with my PA analysis in the previous section, I believe even more strongly that price will head lower in July, if for no other reason than BWs have been selling recently (NOT FINANCIAL ADVICE. ONLY MY OPINION).
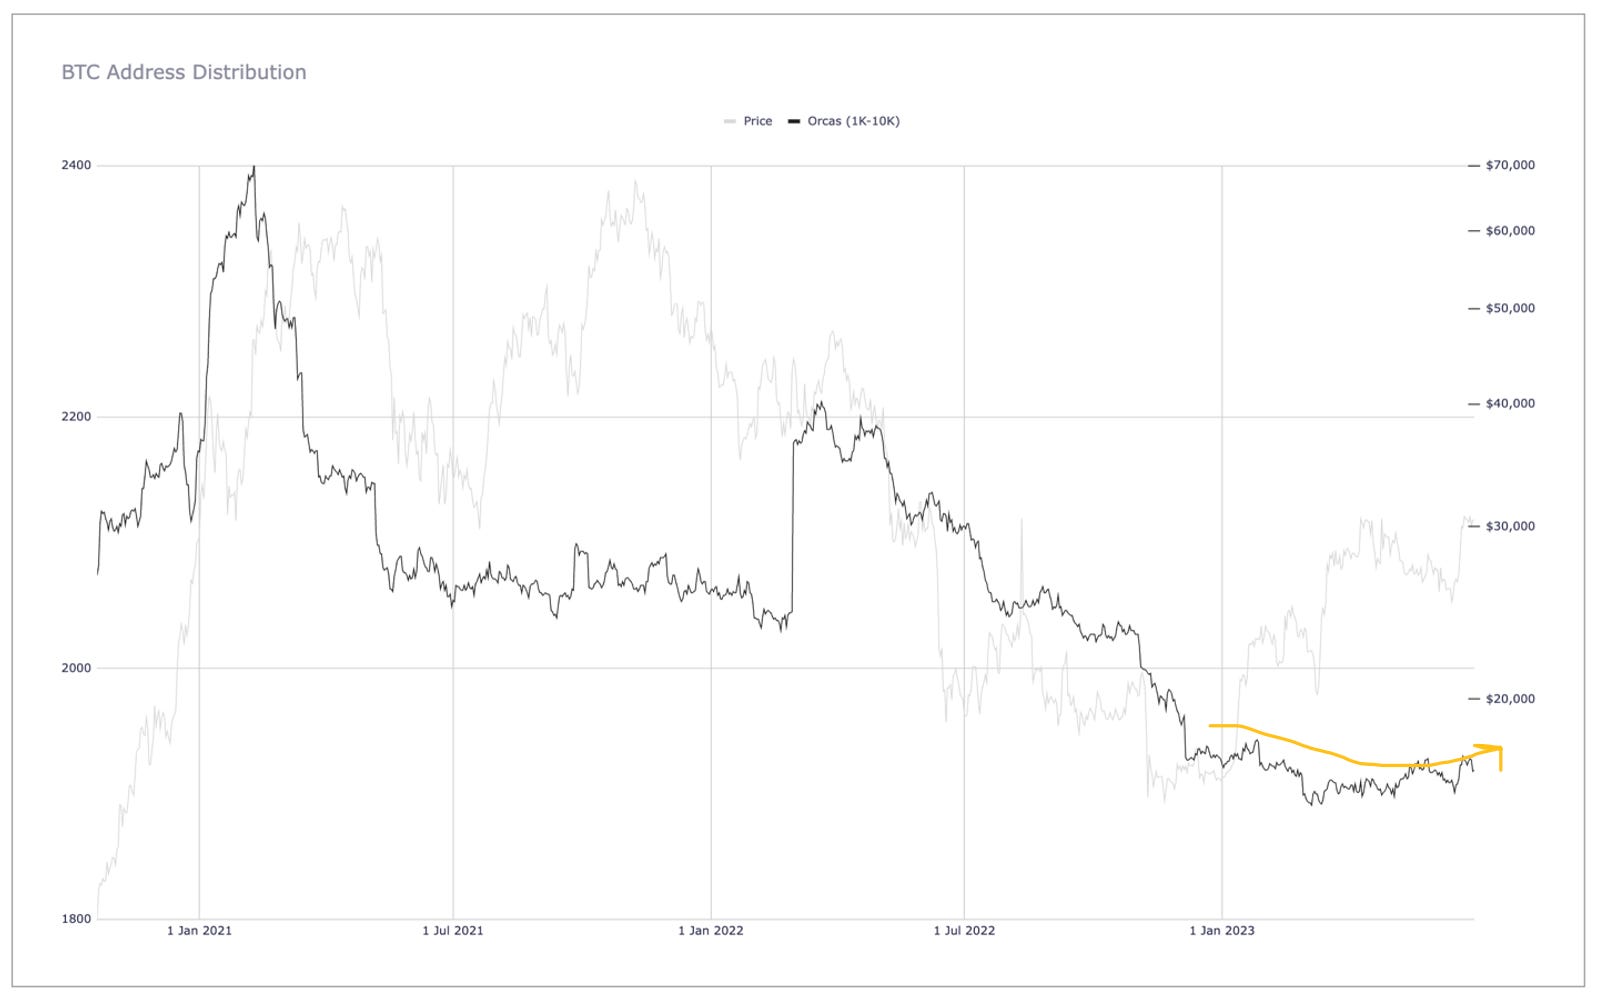
That said, there are some mitigating factors with respect to the aforementioned BW devolution. First, Orca numbers have stabilized and are in fact climbing higher, as shown below. This is a very good sign for the reasons I explain here and here.
Moreover, despite the recent contraction in BW addresses, many of the distributed BW coins are actually due to investors pulling their coins off exchanges:

As shown above, BWs shed 59.7K coins in June, but exchanges shed 47.7K coins overall, meaning 80% of the net loss of BW coins in June can be attributed to exchange outflows (as several exchange wallets are BW wallets). That said, none of the devolved BW wallets were exchange wallets per se, so this is only partial consolation, in my opinion. Nevertheless, exchange outflows are always a positive, indicating that more and more investors are realizing the importance of/safety in using cold storage rather than relying on centralized exchanges to safeguard their coins.
Conclusion
Despite the mid-month price swoon due to the US SEC’s seemingly politically motivated anti-crypto actions, June ended very positively due in no small part to Blackrock’s spot-BTC ETF application. BTC therefore enters July riding a wave of optimism, particularly with the rumor circulating that Gary Gensler may be stepping down as head of the SEC. Nevertheless, the rhythm of the four-year halving cycle, combined with some very strong calendar-month trends and the recent BW devolution, have led me to believe July may be a down month for price. This of course is total speculation on my part and certainly not financial advice, but it is nevertheless my expectation. Not that it matters one iota to my own stack. I accumulated as much as I could during the depths of the bear market, so I am merely a spectator for now with no intention of selling until/unless there is extreme euphoria in the market. What might that look like? Other than the obvious post-halving euphoria anticipated 18-24 months from now, I do think there could be a temporary craze if/when one or more BTC spot-ETF applications gets approved.
More specifically, I think there will be a sizable pump upon ETF approval but a sizable dump upon ETF launch (NB: not immediately upon launch because of the likely initial $1B+ capital inflow, but in the days following the initial capital inflow). I will share my thoughts more about PA if/when one or more ETFs is approved, but this is what I envision based merely on my many decades investing. Time will of course tell whether I am correct. Let’s hope we get the chance to find out.
Before I close for the month, below is a list of random but interesting facts that I have noticed in the on-chain data I track. I leave them for your consideration without comment. Note that some will seem decidedly positive while others may seem downright scary. Do with these data what you will, but speaking only for myself, I have never been more confident about BTC’s future than I am today.
Random “Fun” Facts in the On-Chain Data
The top 2.1% of addresses (Fish thru BWs; sans Minnows) control 93% of all BTC
The top 0.33% of addresses (TSs thru BWs) control 82% of all BTC
The top 0.033% (15.9K) addresses control just under 60% (59.2%) of all BTC
BUT…
Retail buyers (Minnows and Fish) control 17.9% of all BTC
Orcas own 841K fewer coins than they did at their peak in January 2021
STILL…
Binance and Coinbase combined control 54% of all exchange inventory
Binance and Coinbase combined control 5.2% of the total BTC supply
Go #BTC.