
Disclaimer
The data I use (BitInfoCharts, Coinglass, CoinMarketCap) to compile the tables and graphs contained in the on-chain section of this analysis do not always align with data found via others sources like Glassnode and CryptoQuant. I cannot explain the reason for the differences nor can I confirm which sources are most accurate. For this and other reasons, I have come to trust only the on-chain data I collect when trying to explain and/or predict Bitcoin’s (BTC) future price action (PA). Whether you too find my on-chain analysis useful is for you to decide, but I can assure you that some of my observations and/or predictions will differ, often markedly, from other observations and/or predictions you will see on Crypto Twitter (CT) and elsewhere.
Price Action
Finally. A down month for the corn. I know many are wringing their hands over the current swoon, not knowing when it will cease, but my goodness. We had six straight months of up only, literally unprecedented PA in Bitcoin’s 13-year history.
Price opened April at $71,290 (on Coinbase), climbed to a peak of $72,777 a week later, and then spent the rest of the month bleeding out. When all was said and done, price closed the month down 14.98% at $60,622.
Below are the calendar month returns for Bitcoin throughout its history:
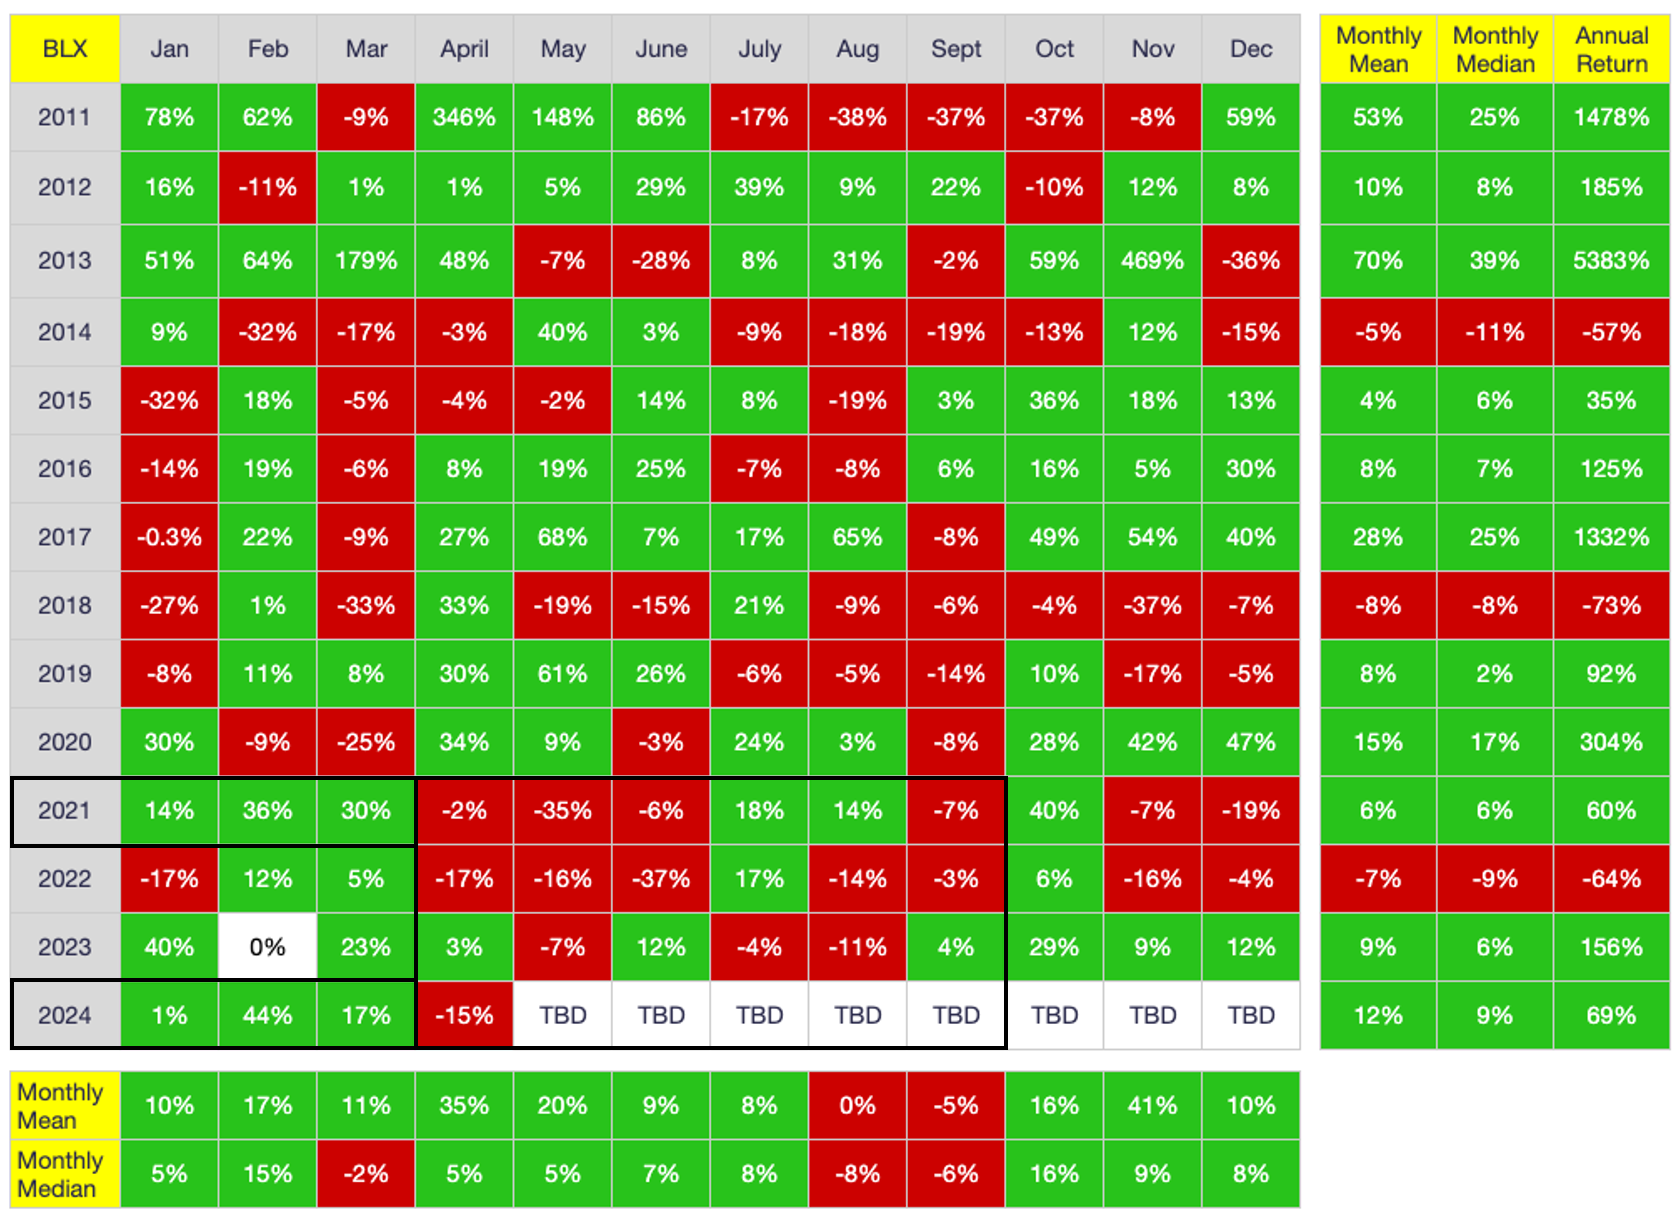
As shown above, both 2021 and 2024 closed lower in April following a three-month gain to start the year. Unfortunately, so too did price close lower in three of the following five months in 2021. Moreover, as shown, price has struggled during the summer months more generally, at least since 2021. While I generally don’t believe in the predictive validity of calendar-month returns as they relate to Bitcoin, they do hold for traditional markets. As such, because a case can be made that institutional investors now rule the Bitcoin roost (e.g., due to US ETFs and MSTR), pricing seasonality may indeed become more commonplace going forward. If so, we longs may be in for a rough couple of months, particularly given the six-month run of higher monthly returns that preceded this month.
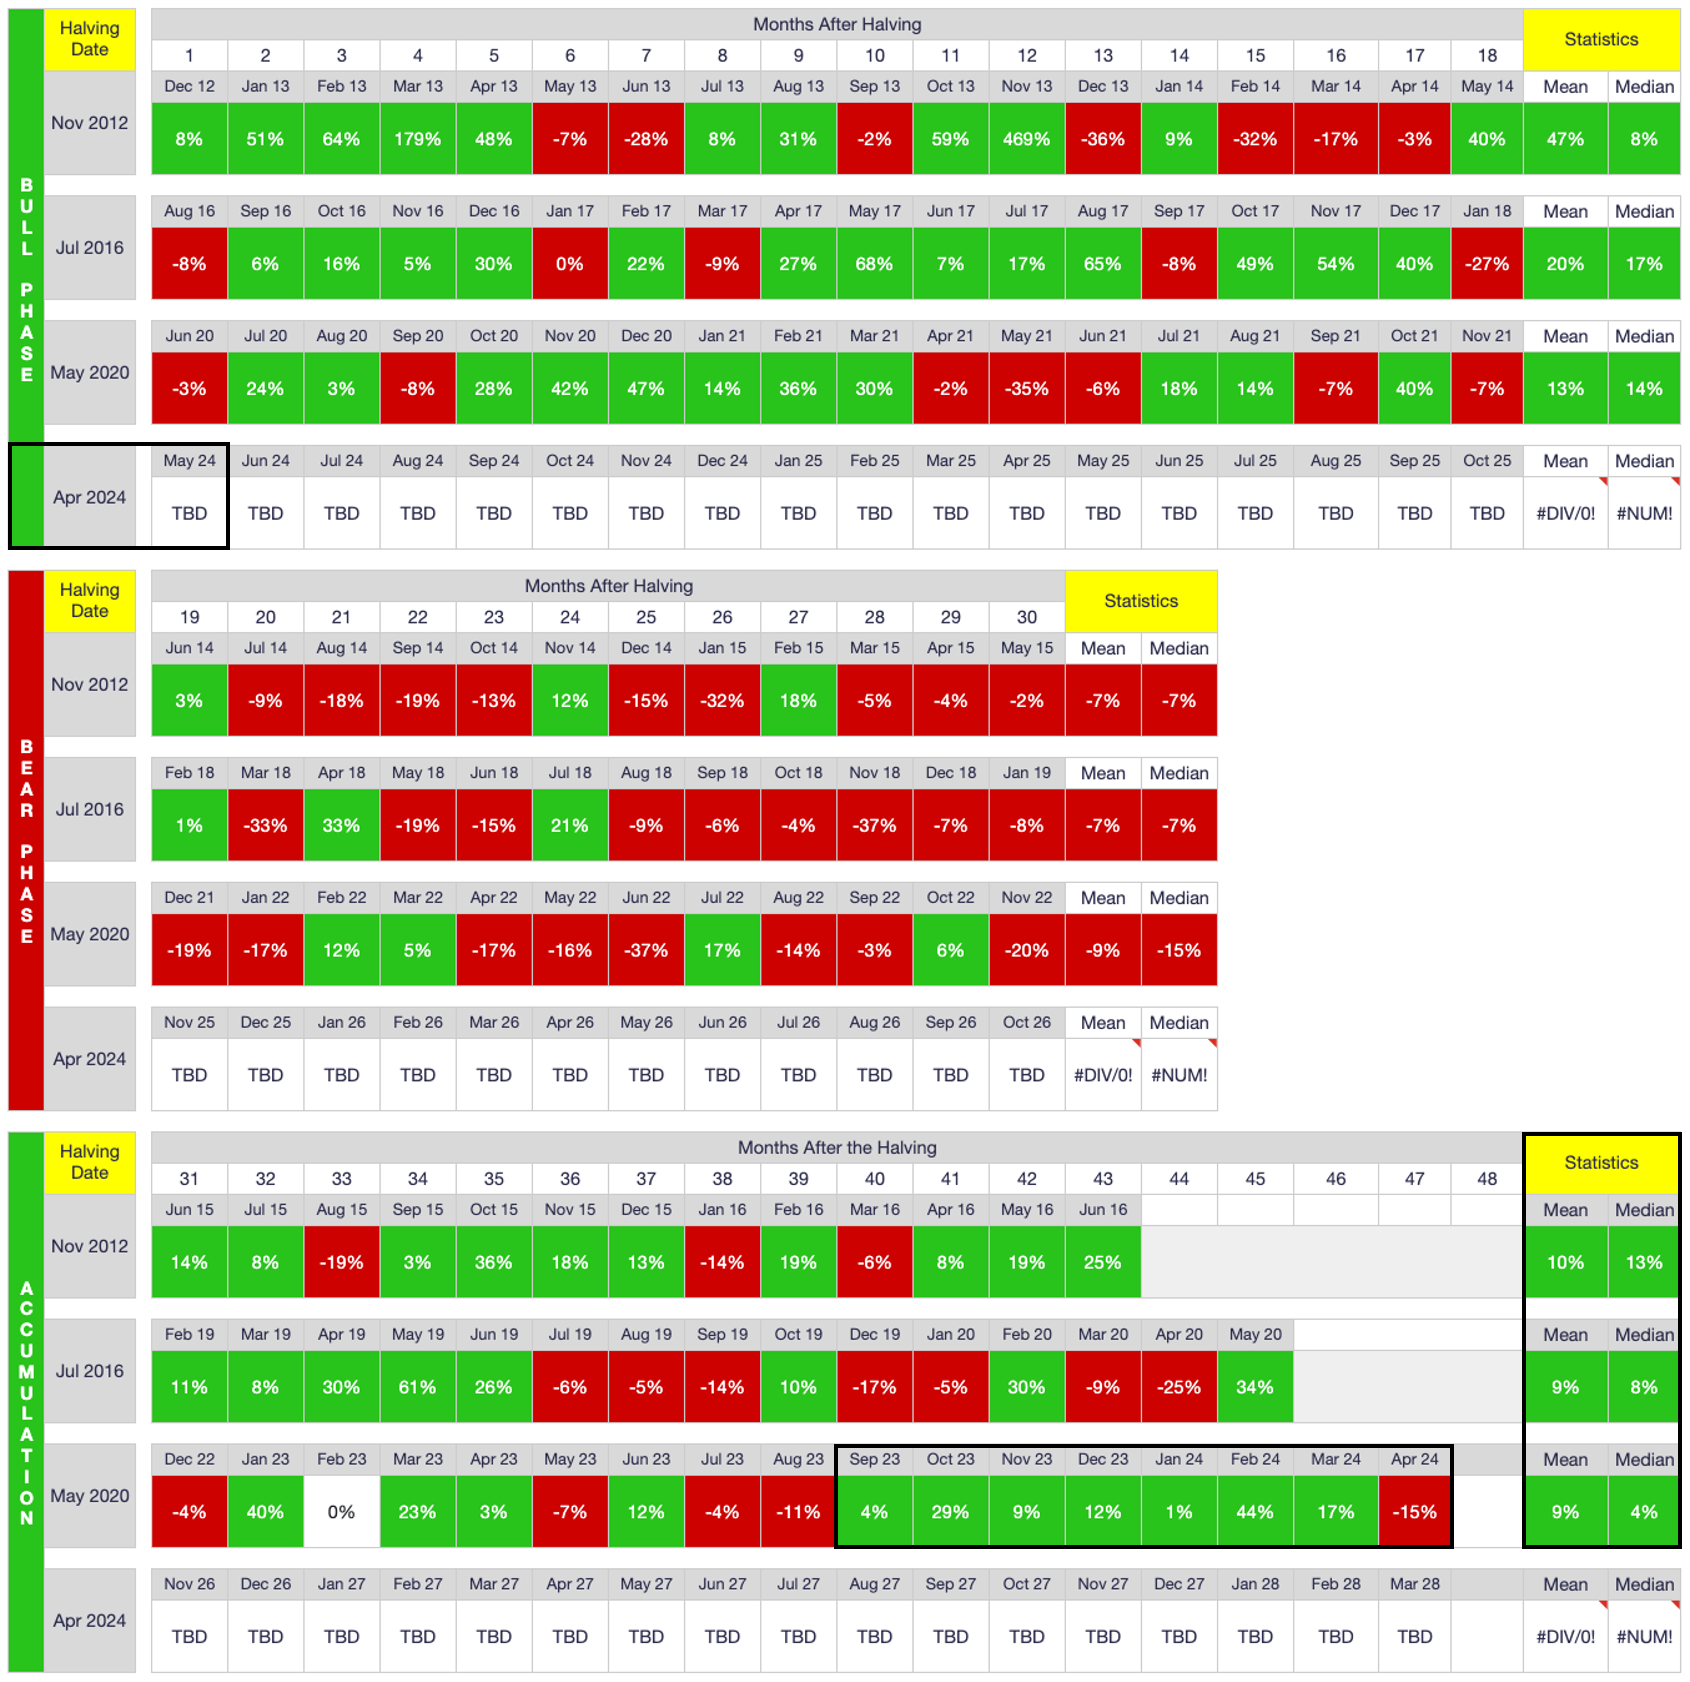
That said, above are Bitcoin’s calendar-month returns reorganized by halving cycle. I assume anyone reading this article is aware that Bitcoin just had its fourth halving on April 19. As such, we are about to kick off the most bullish period of each halving cycle, which is the 15-18 month period immediately following the halving.
As shown above in the top-third of the table, the upcoming bull phase should print mostly green from month to month if past performance is any indication of future performance. That said, note that the first full month following each halving did in fact close lower the previous two halvings (July 2016, May 2020) and only modestly higher after the first halving (November 2012). Moreover, none of the previous halvings concluded on as bullish a note as this most recent halving cycle did.
As stated earlier and as shown above in the lower-third of the table, Bitcoin had an unprecedented six-month string of higher monthly closes. All told, price rose a staggering 175% over those six months, rising from $25,932 at the end of August 2023 to $71,289 at the end of March 2024. Yes, price almost tripled over that six-month stretch, so to experience a pullback in April was not only reasonable but arguably to be expected. Anyone who follows me and/or reads my month-end analyses should know that I have been expecting a sizable pullback for a couple of months now, not because of anything happening in macroland and certainly not because of any technical indicators, merely because no market goes straight up, not even Bitcoin.
The question now of course is whether the swoon will continue in May or whether $60K will hold as support. As it happens, price is already down another $3K today (May 1), and I would argue price closed above $60K in April only because some whale deemed it so (there was an aggressive mini-pump right before market close yesterday despite the fact price spent a good bit of time below $60K throughout the day).
In other words, I personally expect the current slide to continue. After all, April “only” closed 15% lower and price, even at $57K, is only 23% lower than the all-time high (ATH) of $73,836, which occurred only six weeks ago (on March 14). i.e., After an unprecedented near-tripling of price over a six-month period, expecting price to take a breather seems logical to me. Again, my “prediction” is based solely on 30 years of experience trading many different markets, not based on any previous halving cycle PA, technical analysis, geopolitical events or macroeconomic trends.
All that said, I will point out a potentially troublesome trend on the monthly chart:
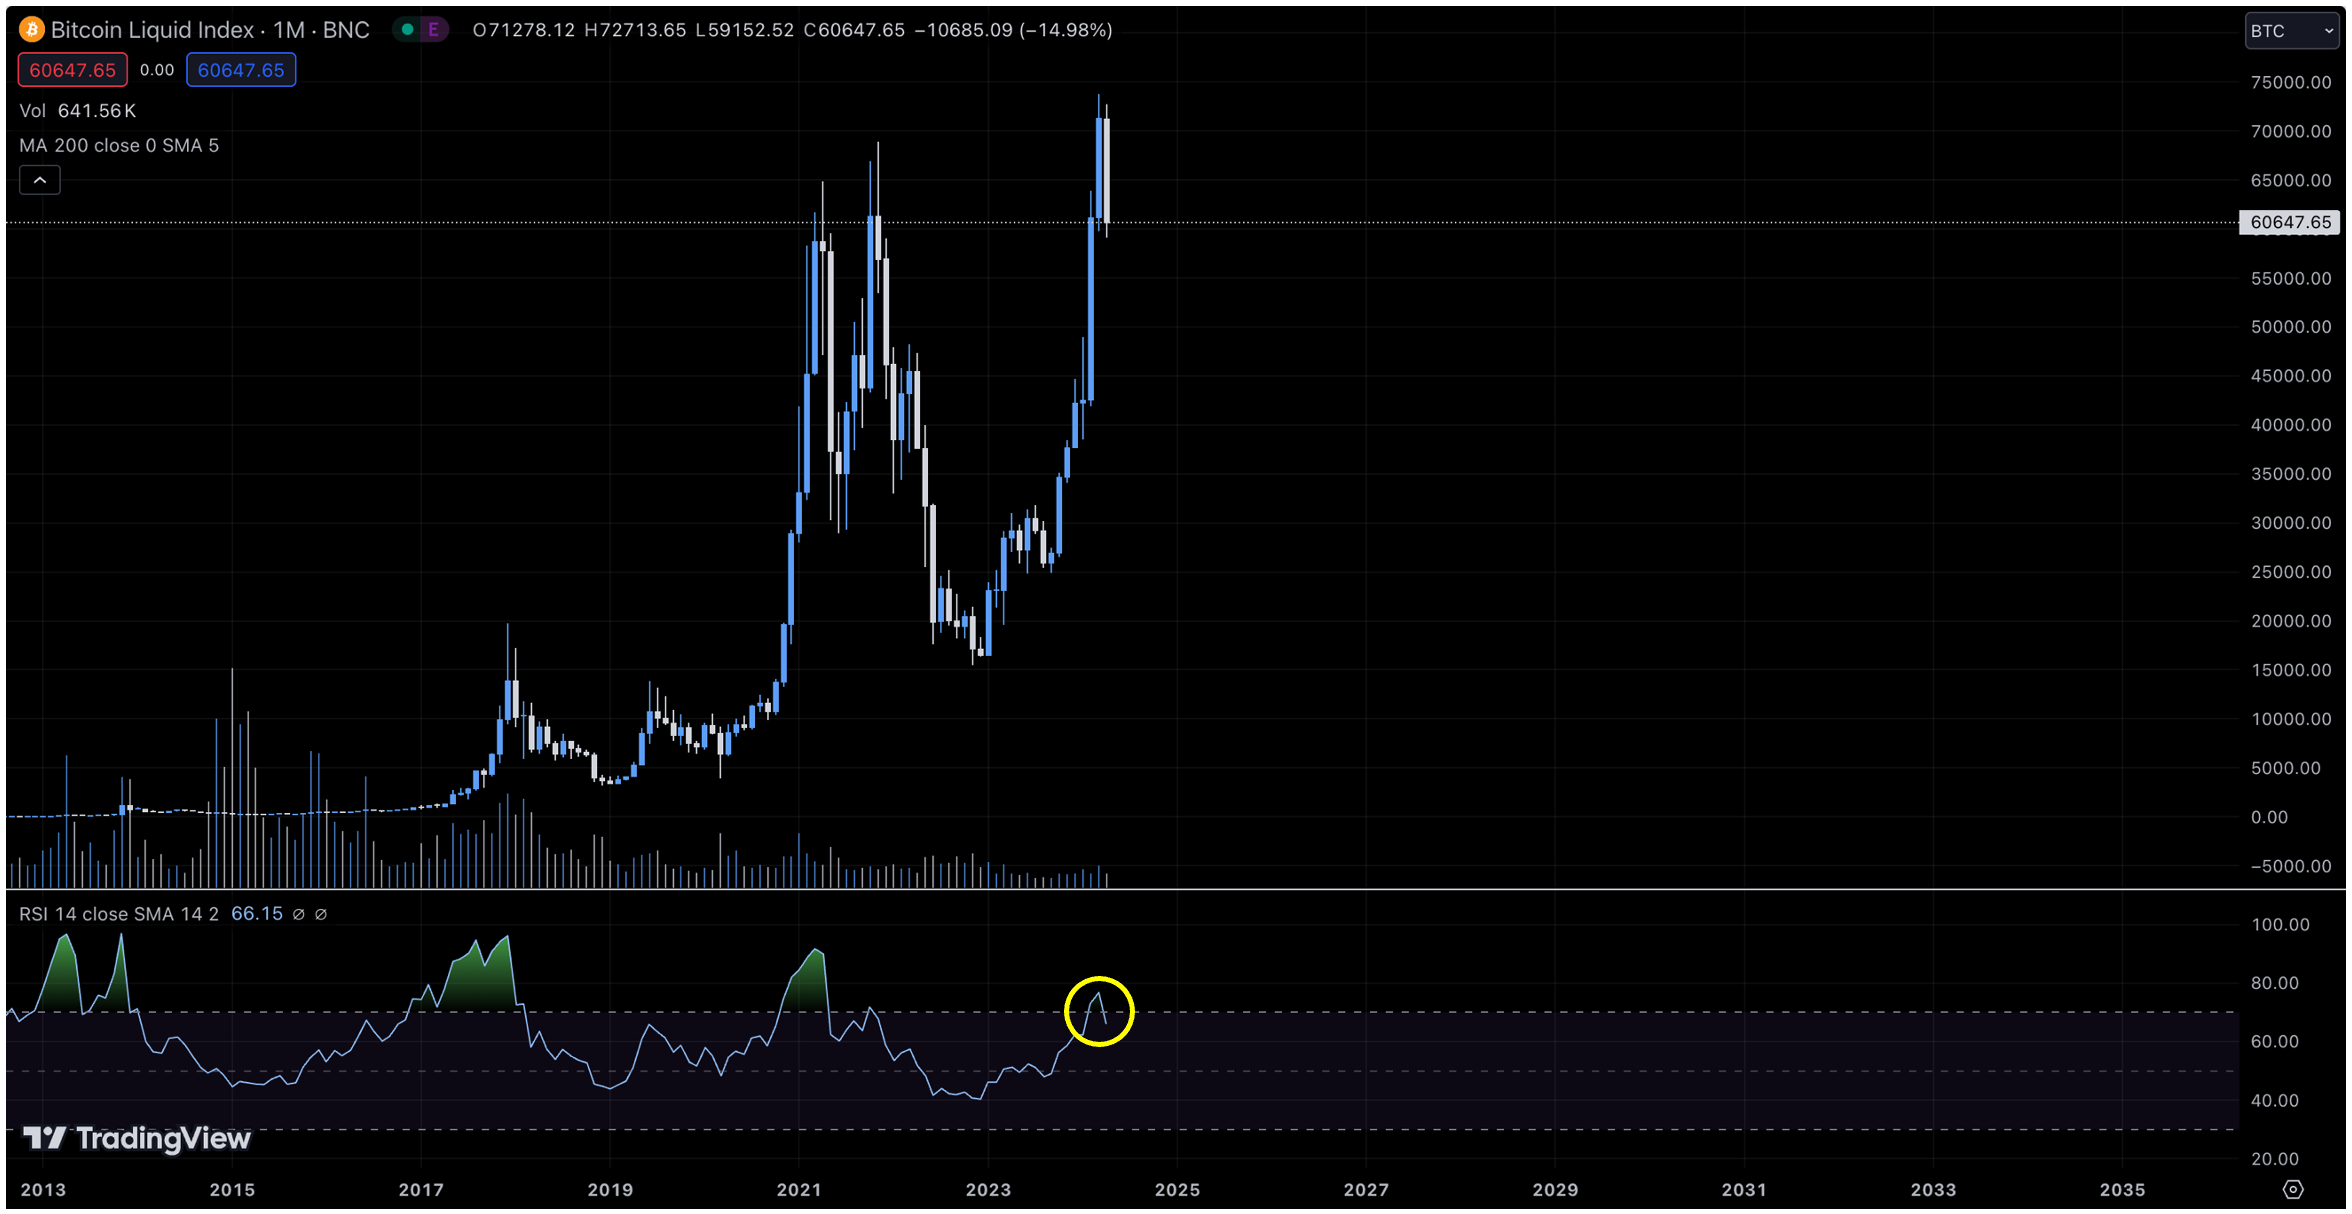
As shown above, the Relative Strength Indicator (RSI) on the monthly chart just spent its shortest duration at/above the “overbought” area (> 70.0) since at least 2013, which isn’t great. Moreover, as shown above, it is rare that price contracts for only one month after a sizable runup like the one we just had. As such, these data reinforce my intuition that we bulls should be prepared for a rough month ahead, if not an entire summer season.
So, sell in May and go away? Not me. While I did sell a bit when price crossed above $70K, that was strictly to replenish my cash hoard for living expenses (for those unaware, I am retired and have no source of income of than my investments). Otherwise, I intend to sell exactly ZERO until I once again need some cash, and that is not for a good long while. i.e., I don’t care what price does over the next several months, even if/though I expect price to consolidate. I’m not selling.
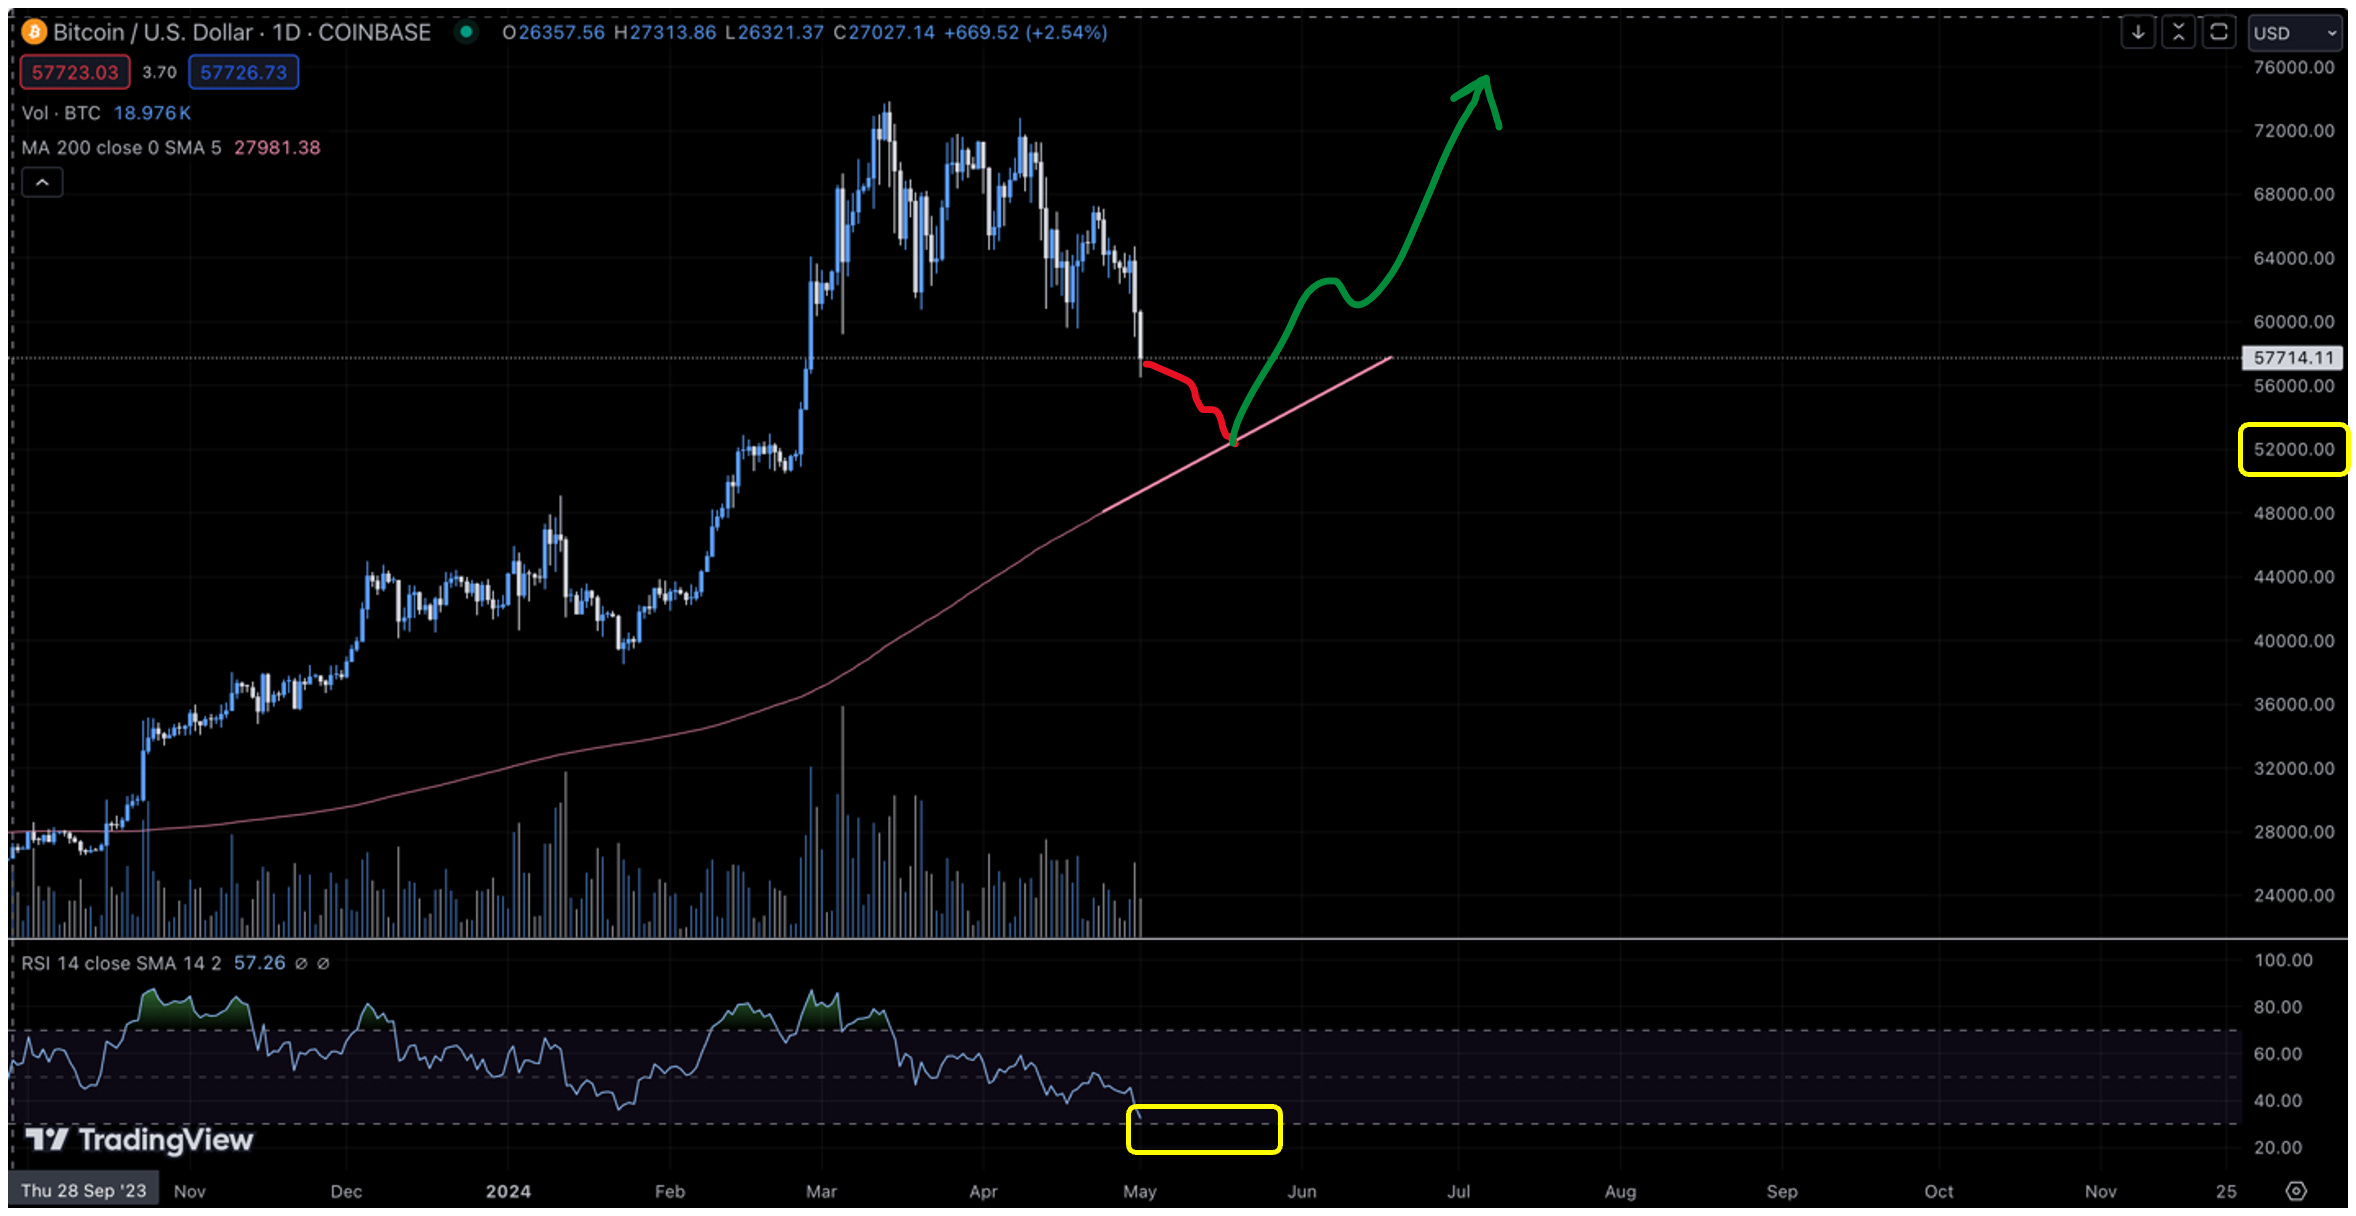
On the other hand, if price plunges to the 200-day moving average over the next month or two, I’ll likely be a buyer. i.e., While I don’t have any free cash flow to speak of, I personally will consider such a dip too attractive to ignore and will roll the dice by reinvesting some of the cash I have set aside for living expenses. Not only would that price (+/- $51K) be an attractive entry point during any Bitcoin bull market, the RSI at that point would likely be dipping well into the “oversold” area, meaning it will be a historically great time to buy even while most others will undoubtedly be wringing their hands, fretting over whether they made a mistake investing in Bitcoin in the first place.
I don’t mean to make light of others’ emotions as it relates to investing, but I’ve been investing long enough now that I have learned to buy when others are fearful and sell when others are greedy. Case in point:
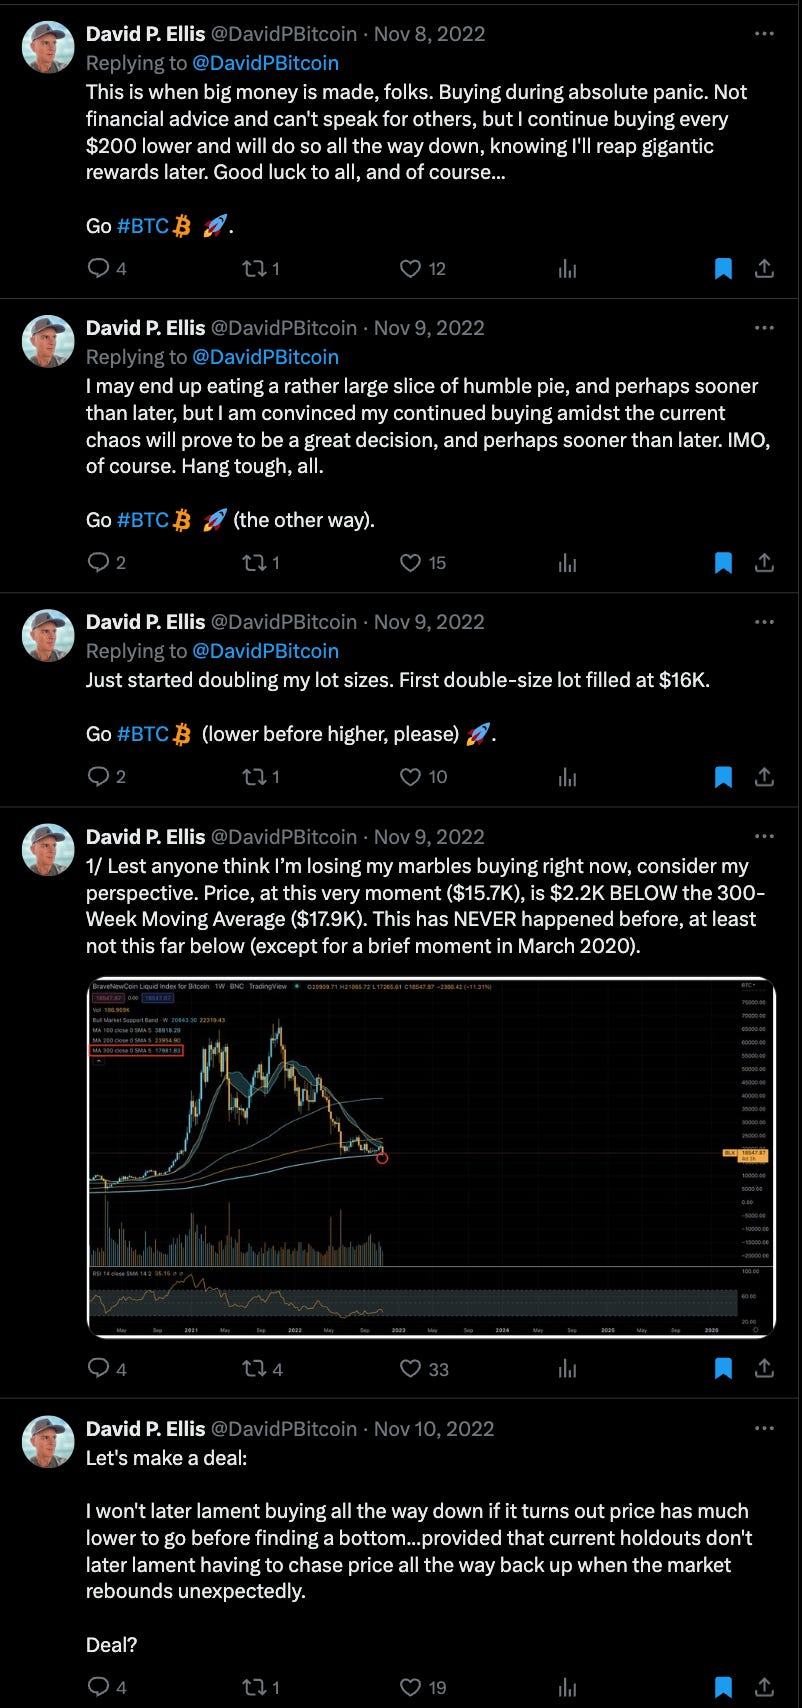
i.e., Post-halving, during the most bullish phase of each Bitcoin halving cycle, dips down to the daily moving average have historically been good buying opportunities (specifically for a swing trade). This is not to say that this trend will always hold true, but I am willing to go with the probabilities for now, at least until they start failing.
In sum, I am not selling a single Sat in the near-term no matter how low price drops, but if price retraces all the way to the 200-DMA over the next month or two, then I will likely start buying again, if only for the swing-trade opportunity. Otherwise, I plan to sit tight no matter what PA does until price crosses above $100K (and it will).
On-Chain Data
Below are the distribution of BTC addresses and coins for the past 12 months:
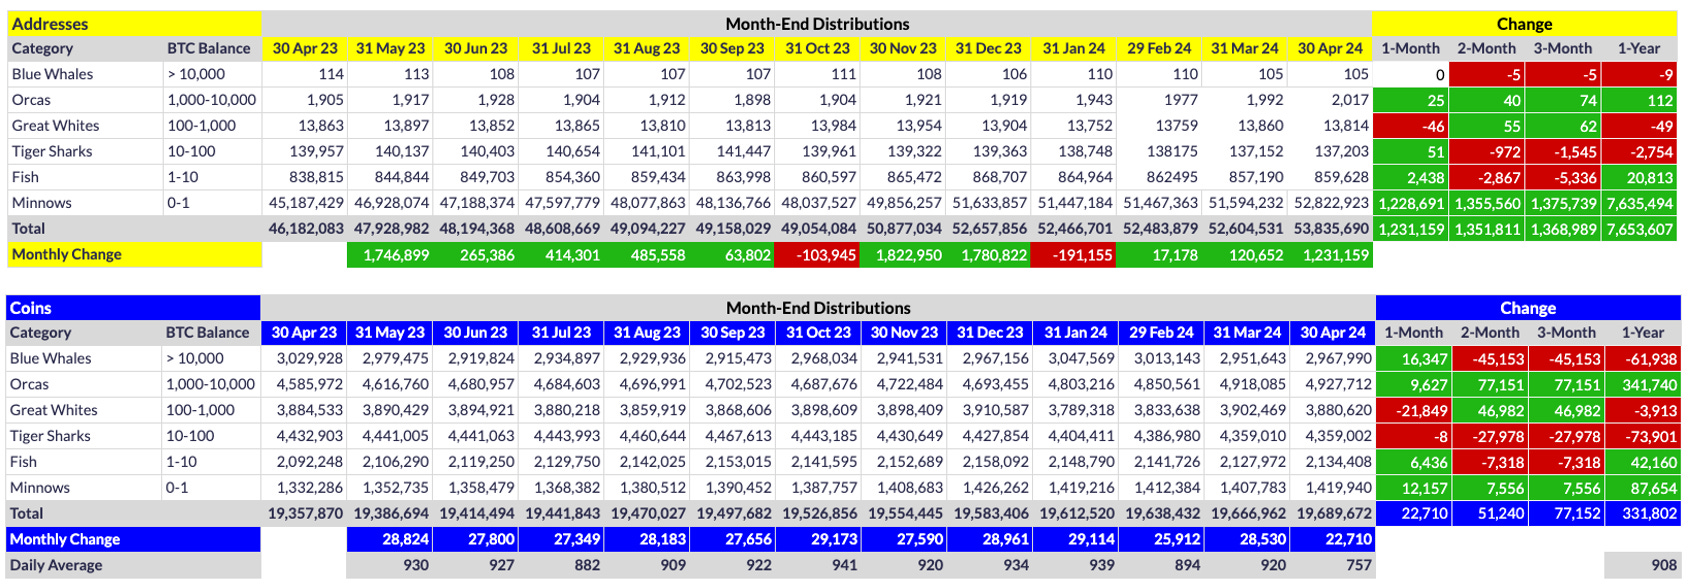
As shown above, downward pressure on price is likely due to rampant selling by Great Whites (GW). In my experience, most GWs seem to be swing/momentum traders, so it isn’t surprising they sold en masse once price failed to make yet another ATH on/after April 8 (the high that day was $72,777, about $1100 short of the current ATH, $73,836). i.e., Once price rolled over, GWs started dumping their bags and away price went.
Despite such selling, note that BW addresses were actually flat on the month and the tier actually gained 16.3K coins. Perhaps even more importantly, 25 Orcas evolved as well, soaking up 9.6K of the coins vomited by GWs. For those who have followed me for a while, I am convinced Orca trends have the most predictive validity of the myriad price indicators in existence. As such, I am especially bullish given recent Orca growth despite price pulling back in April.
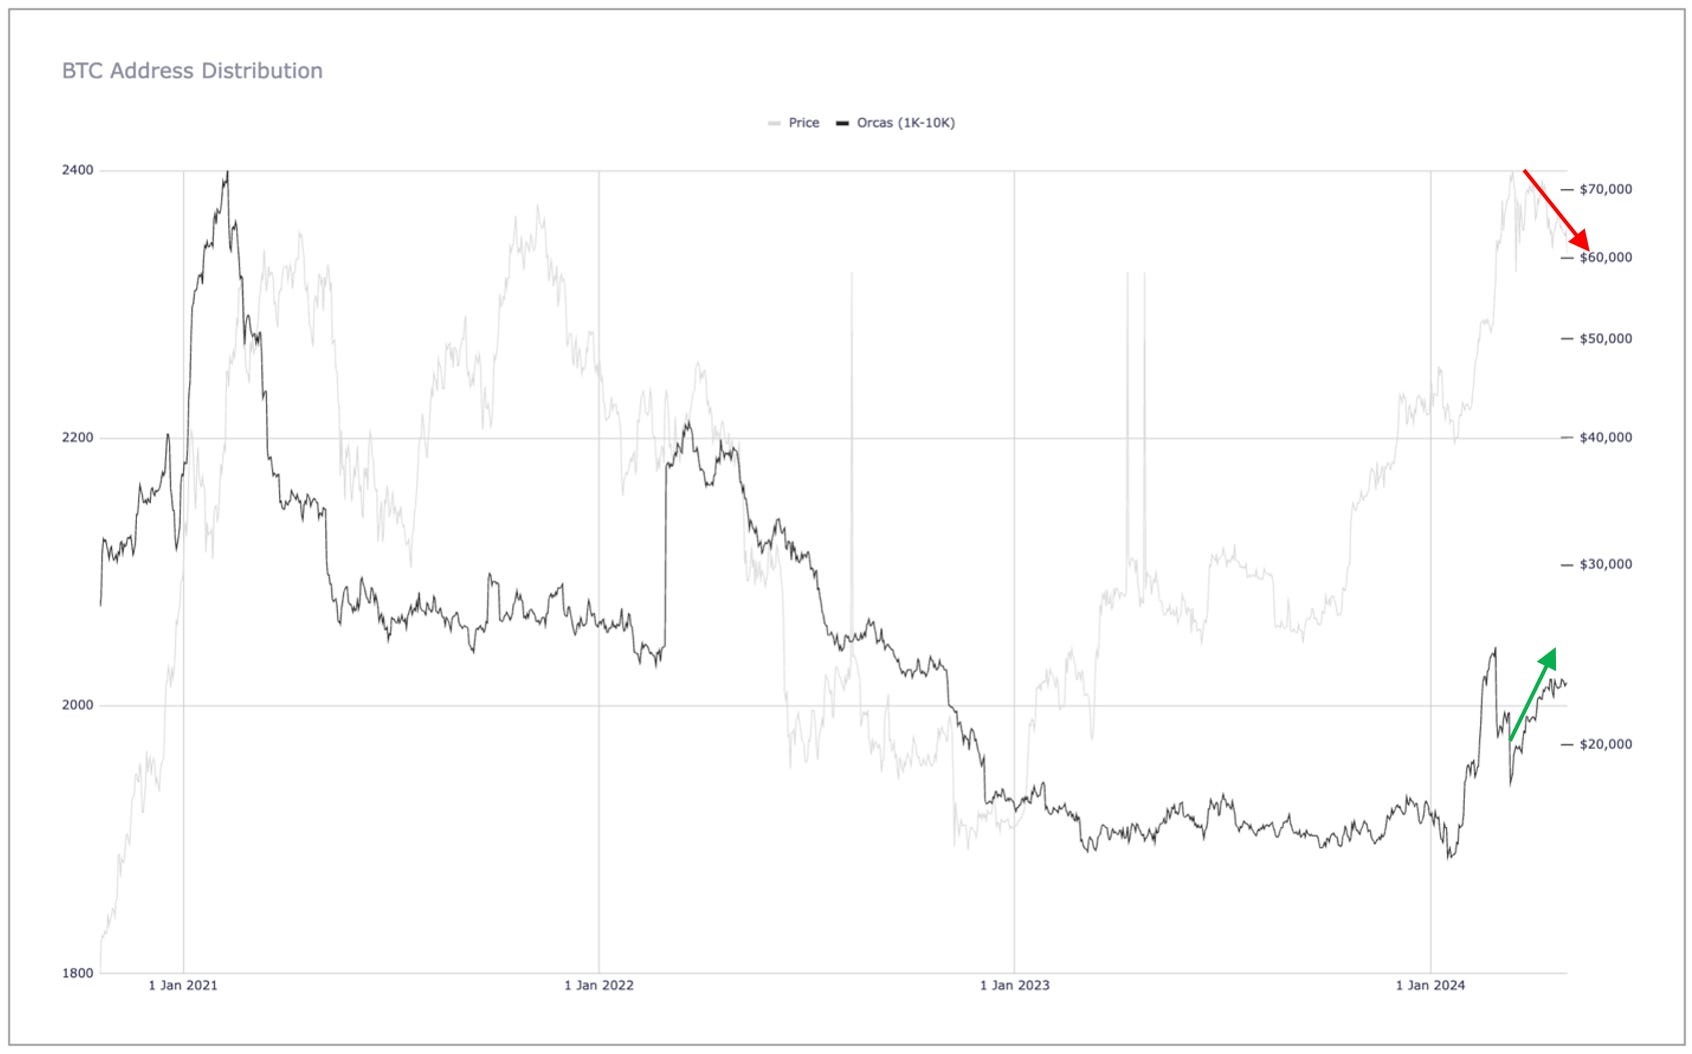
As shown above, what I consider to be a bullish divergence has formed on the Orca chart. That is to say, Orca addresses have been increasing recently despite the fact that price has been retracing the past three weeks. As I illustrated in the Orca article linked above, Orca trend changes often precede price-trend changes by 2-3 weeks, if not even a bit longer. It is for this reason alone I see a bullish narrative that could counteract/disprove my otherwise bearish near-term intuition. If Orcas continue expanding in number throughout May, price WILL recover, and substantially so. That remains a big if, but it is something to watch closely over the next several weeks.
Another interesting whale trend is the change in BW addresses over time.
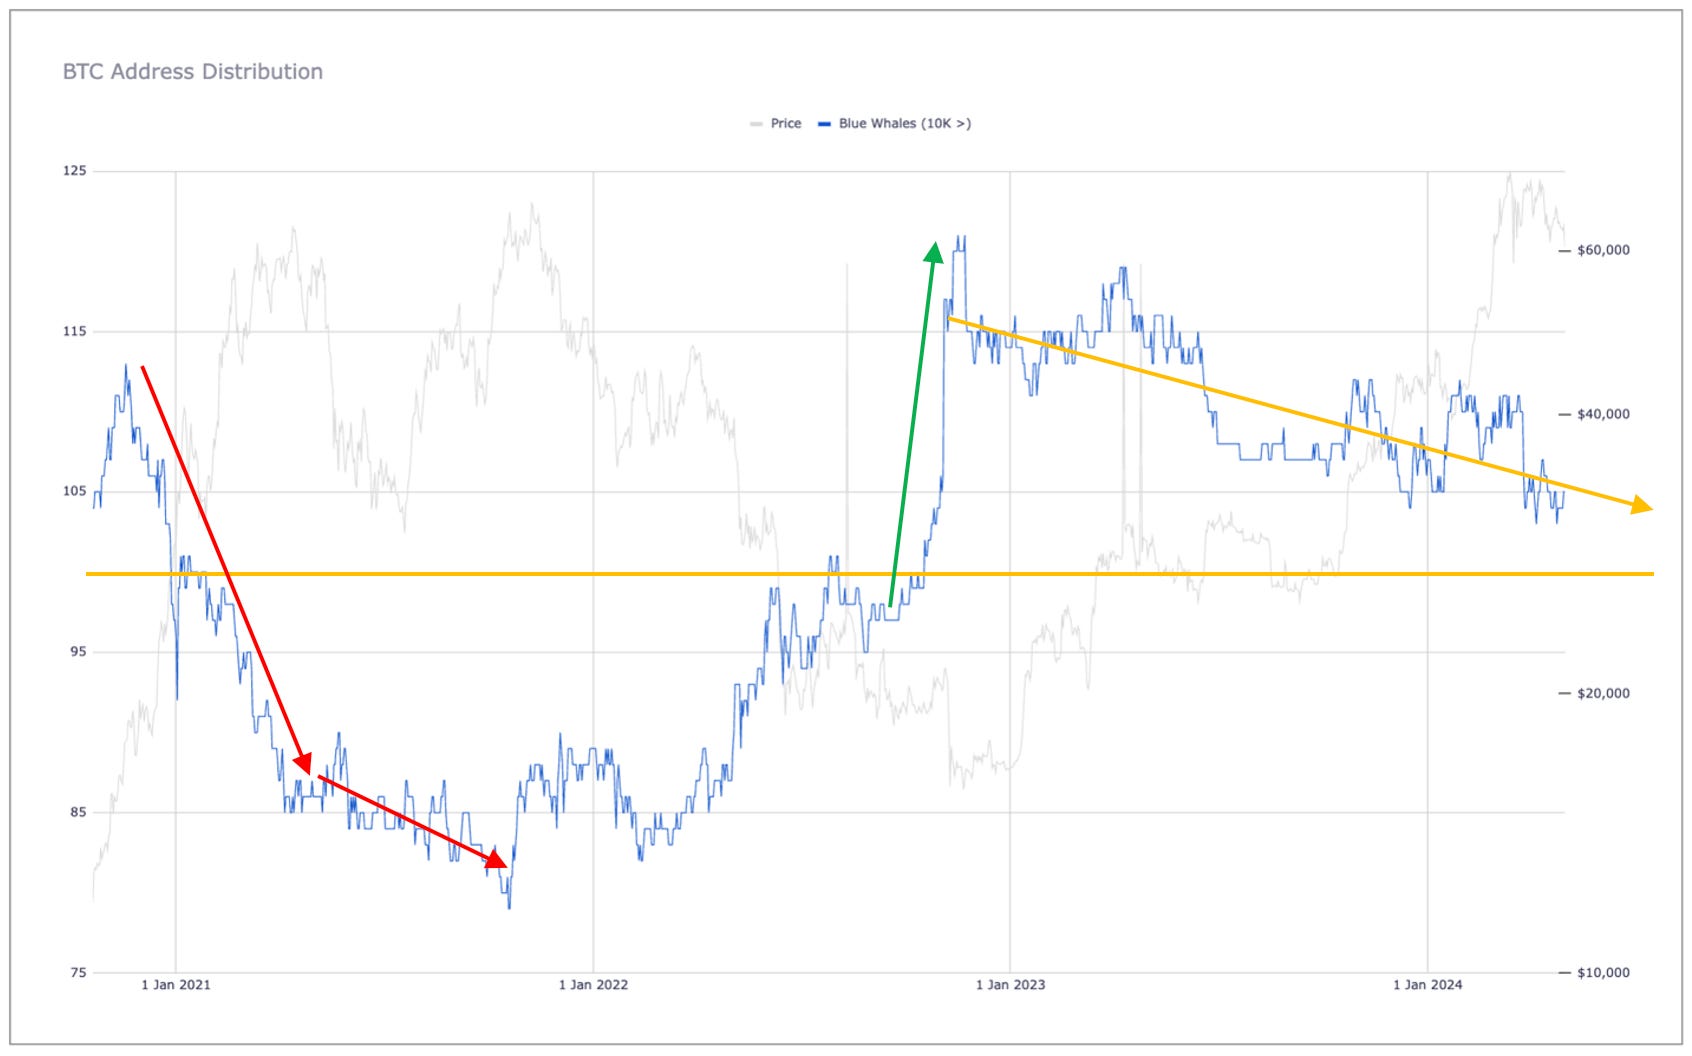
As shown above, there has been a gradual decline in BWs since December 2022 after an exponential increase during the bear market that was the entirety of 2022 (from a low of 84 on February 4, 2022, to a peak of 116 on December 7, 2022). While a gradual decline in BWs could be seen as bearish, I would argue it is actually bullish, at least relatively speaking. As shown on the left side of the chart above, there was a much more precipitous decline in BWs after the 2021 bull run, with 28 BWs devolving in just four months (between December 2020 and April 2021). Moreover, the decline continued until late 2021.
In contrast, the maximum contraction during this most-recent six-month bull run was 12 (from 116 to 104), and the number of BWs has since seemed to have found a floor at around 105. In other words, despite the massive price pump between September 2023 and March 2024, a relatively small number of BWs distributed, which is very different from the last bull run between December 2020 and March 2021 (NB: I have chosen to ignore the PA of late 2021, which was an anomaly for a number of reasons).
All of this is to say that despite the 15% pullback in price during April, the health of whales is not only in tact but arguably increasing. While this no doubt has a lot to do with the US ETFs that were approved in January, their growth slowed considerably in April, so the net whale growth shown above is largely above and beyond the modest gains US ETFs experienced over the same time period. i.e., US ETFs are NOT the only game in town (though admittedly, they clearly are important for PA).
More evidence of the health of whales can be seen via exchange inventory flows:
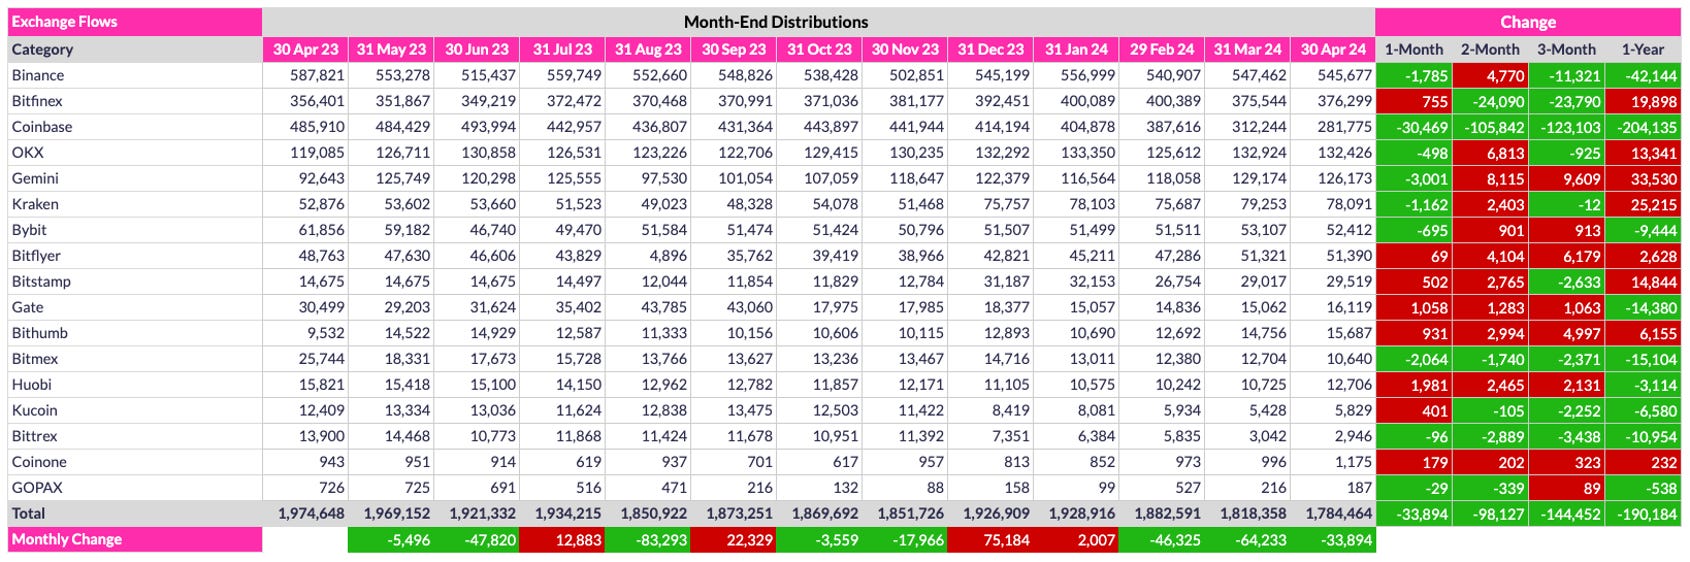
As shown above, many of the listed exchanges above experienced outflows during April, but none more so than Coinbase. In fact, Coinbase’s outflows over the past 12 months have been nothing short of staggering: 30.5K in April, 105.8K the past two months, 123.1K the past three, 204.1K the past year. Put another way, 42% of Coinbase’s inventory has evaporated over the past 12 months. While there is obviously no guarantee this same rate of outflow will continue, Coinbase would be entirely devoid of coins in October 2025 if the same outflow rate were to continue. While I sincerely doubt such a “crisis” will occur along this exact timeline, there is no question it will occur eventually, and I for one cannot wait to watch from the sidelines, with my stack in deep cold storage all the while.
US Exchange Traded Funds (ETFs)
As intimated earlier, US ETF growth slowed dramatically during April:
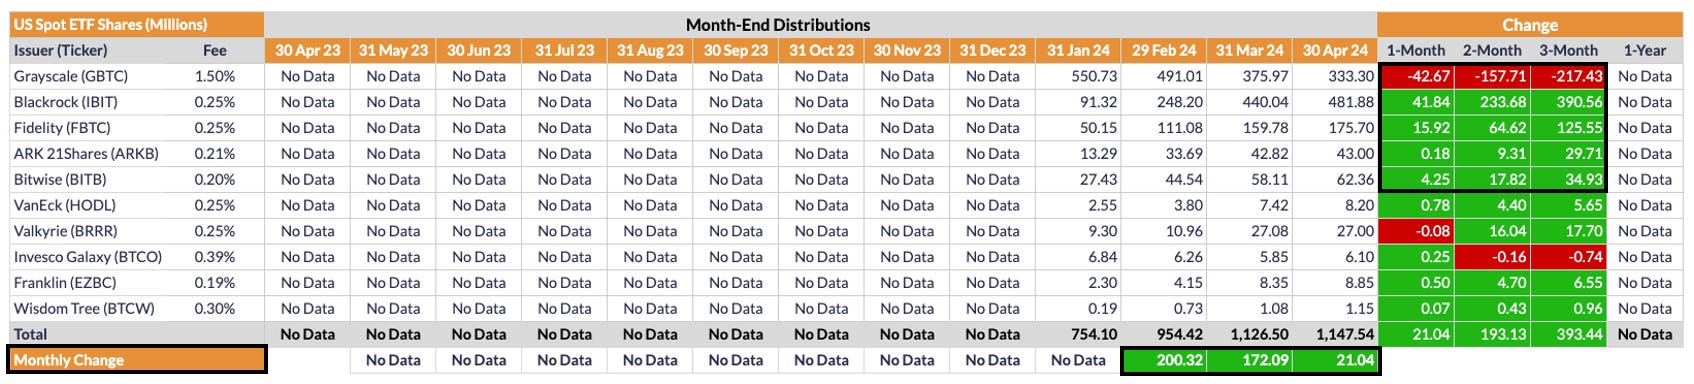
As shown above, US ETFs collectively added 21.04M shares in April, but that growth rate pales in comparison to the 172.1M shares they added in February and the 200.3M shares they added in January (the latter number of which is all the more impressive given that the expansion occurred only during the final two weeks of January).
Although not shown above, US ETFs have in fact started contracting, with net losses the final few days of April. Whether this contraction continues in May remains to be seen, but given the spectacular exponential growth they experienced from the time of launch, a breather is certainly to be expected. Nevertheless, it is interesting to see how differently each ETF is faring relative to the others. Most notably is GBTC, which has contracted literally every single day it has traded. That is almost unfathomable.
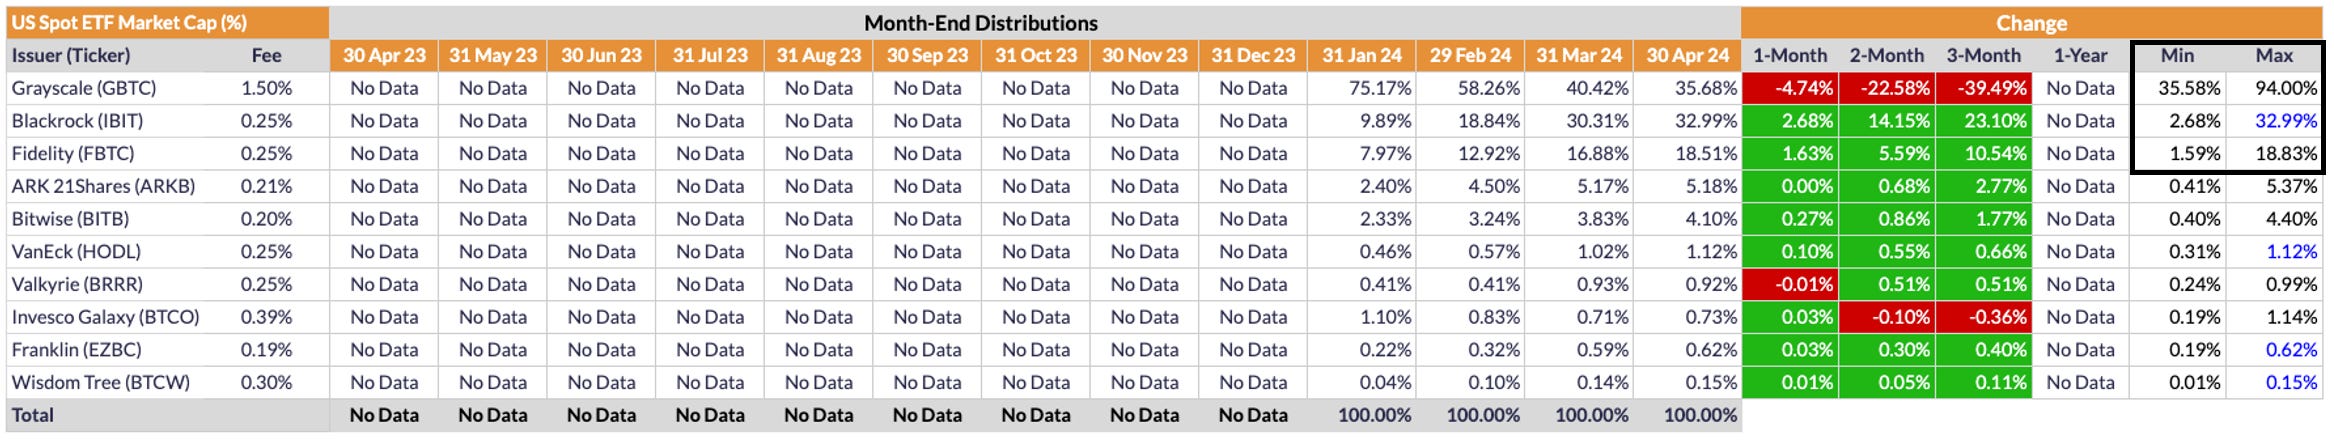
As shown above, GBTC’s share of the total US ETF market has shrunk from a peak of 94% to below 36% over the past three months while IBIT and FBTC have soaked up the majority of that deleveraging, combining to now control more than 50% of the total ETF market. At the current rate of growth and contraction, respectively, IBIT should surpass GBTC in market share within weeks, and there is even an outside chance FBTC will eventually surpass GBTC, incredible as that seems.
While many have surmised that GBTC’s ongoing deleveraging is the reason for April’s price pullback, I disagree. As shown in the penultimate table above, GBTC “only” shed 42.67M shares in April, which is far fewer shares than they shed in March (157.7M) and February (217.4M). If anything, the slowing growth of other ETFs is what led to price stalling, which in turn prompted momentum traders (Great Whites) to lock in profits. In so doing, leveraged longs got liquidated, smaller traders decided to lock in profits, more longs got liquidated trying to catch a falling knife, etc.
Long and short, GBTC continues contracting each and every trading day, but its rate of contraction has slowed dramatically, so we longs need to look for reasons other than GBTC contraction to explain current PA. GBTC selling is not responsible.
One other interesting note re: US ETFs before concluding this section:
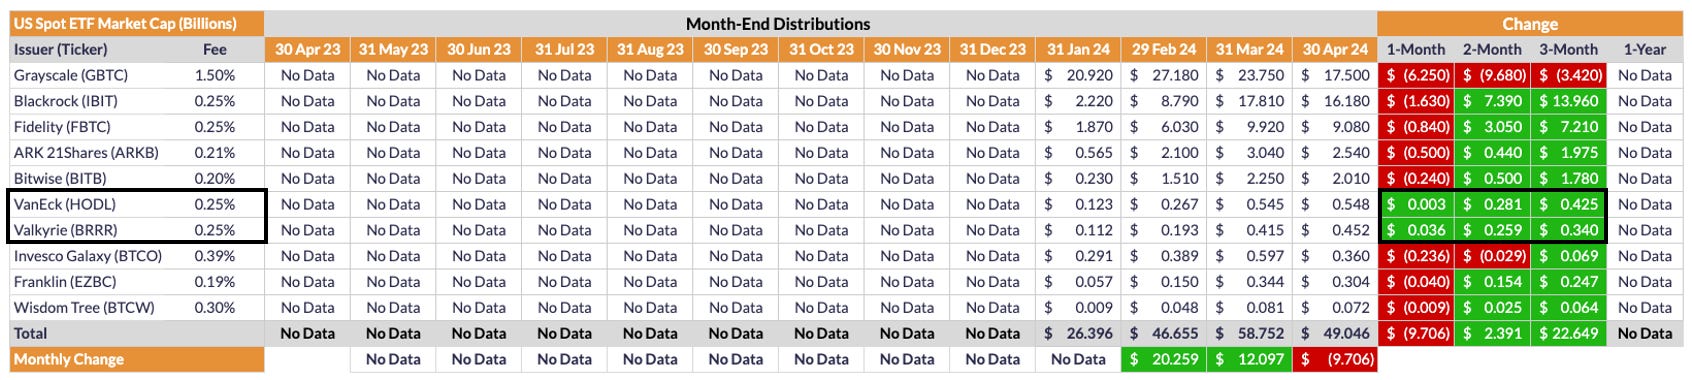
Note above that while nearly all ETFs experienced a contraction in market cap due to the price drop in April, HODL and BRRR actually bucked the trend, adding a bit of market cap despite the price drop. While I don’t have time to investigate the reasons for this anomaly, I suspect it is because these two ETFs are retail-centric, and as shown earlier (in the address table), retail buyers (Fish and Minnows) have been pouring into BTC recently, presumably due to the halving narrative, so a comparable number of retail buyers likely piled into these two ETFs as well. Whatever the case, it is good to see these smaller ETFs holding their own in the face of such behemoths like GBTC, IBIT and FBTC.
Conclusion
While my Twitter feed is rife with fear and coping due to the current 23% pullback in price from the ATH reached on March 14, I for one am finally breathing again. The up-only exponential increase in price between September 2023 and March 2024 was becoming worrisome, at least to me. Yes, US ETFs just got approved in January, so I of course expected bullish PA shortly thereafter, even with the so-called front-running that occurred in Q4 2023. As I stated repeatedly back then, there was no scenario under which US ETF approval would be a sell-the-news event. Still, no asset increases in price indefinitely, so after an unprecedented six-month bull run, I actually welcome April’s pullback. The question now is whether it will continue in May and beyond. I actually think so. Summers are historically weak PA and the previous six-month near-tripling of price was simply too much too fast, in my opinion. I think now is an opportune time for price to contract and consolidate for a while, find a new floor, harden wanna-be hodlers, and divest the market (at least temporarily) of any remaining leveraged longs. That said, we did just have another halving, essentially making BTC the hardest asset on the planet, with a stock-to-flow rate now even lower than that of gold. Moreover, Orca counts are on the upswing and BW counts are stabilizing, so if these two latter trends continue, then yes, April may be the lone down month for the foreseeable future. I in fact always choose data over intuition, so if we see continued Orca growth in the coming weeks, then intuition be damned. LFG. But that remains a big if for the moment. Let’s watch and see. Whatever the case, we longs all know whatever happens in the near-term, there is only one ultimate outcome for BTC, and that of course is higher. Much much higher.
Go #BTC.
Best monthly email you can possibly get on all this. Why any Bitcoin hodler wouldn’t want this information is beyond me!! Thanks David!
How do I quit the program?????
Dawn Fazende
dawn@msmag.org