
Month-End Analysis

Disclaimer
The data I use (BitInfoCharts, Coinglass, CoinMarketCap) to compile the tables and graphs contained in the on-chain section of this analysis do not always align with data found via others sources like Glassnode and CryptoQuant. I cannot explain the reason for the differences nor can I confirm which sources are most accurate. For this and other reasons, I have come to trust only the on-chain data I collect when trying to explain and/or predict Bitcoin’s (BTC) future price action (PA). Whether you too find my on-chain analysis useful is for you to decide, but I can assure you that some of my observations and/or predictions will differ, often markedly, from other observations and/or predictions you will see on Crypto Twitter (CT) and elsewhere.
Price Action
February 2023’s price action (PA) was, in my opinion, the most intriguing month this entire cycle, and that is saying a lot for those who have been keeping score at home. As shown below, price closed two CENTS higher than it opened, opening at $23,135.82 (on BLX) and closing at $23,135.84.
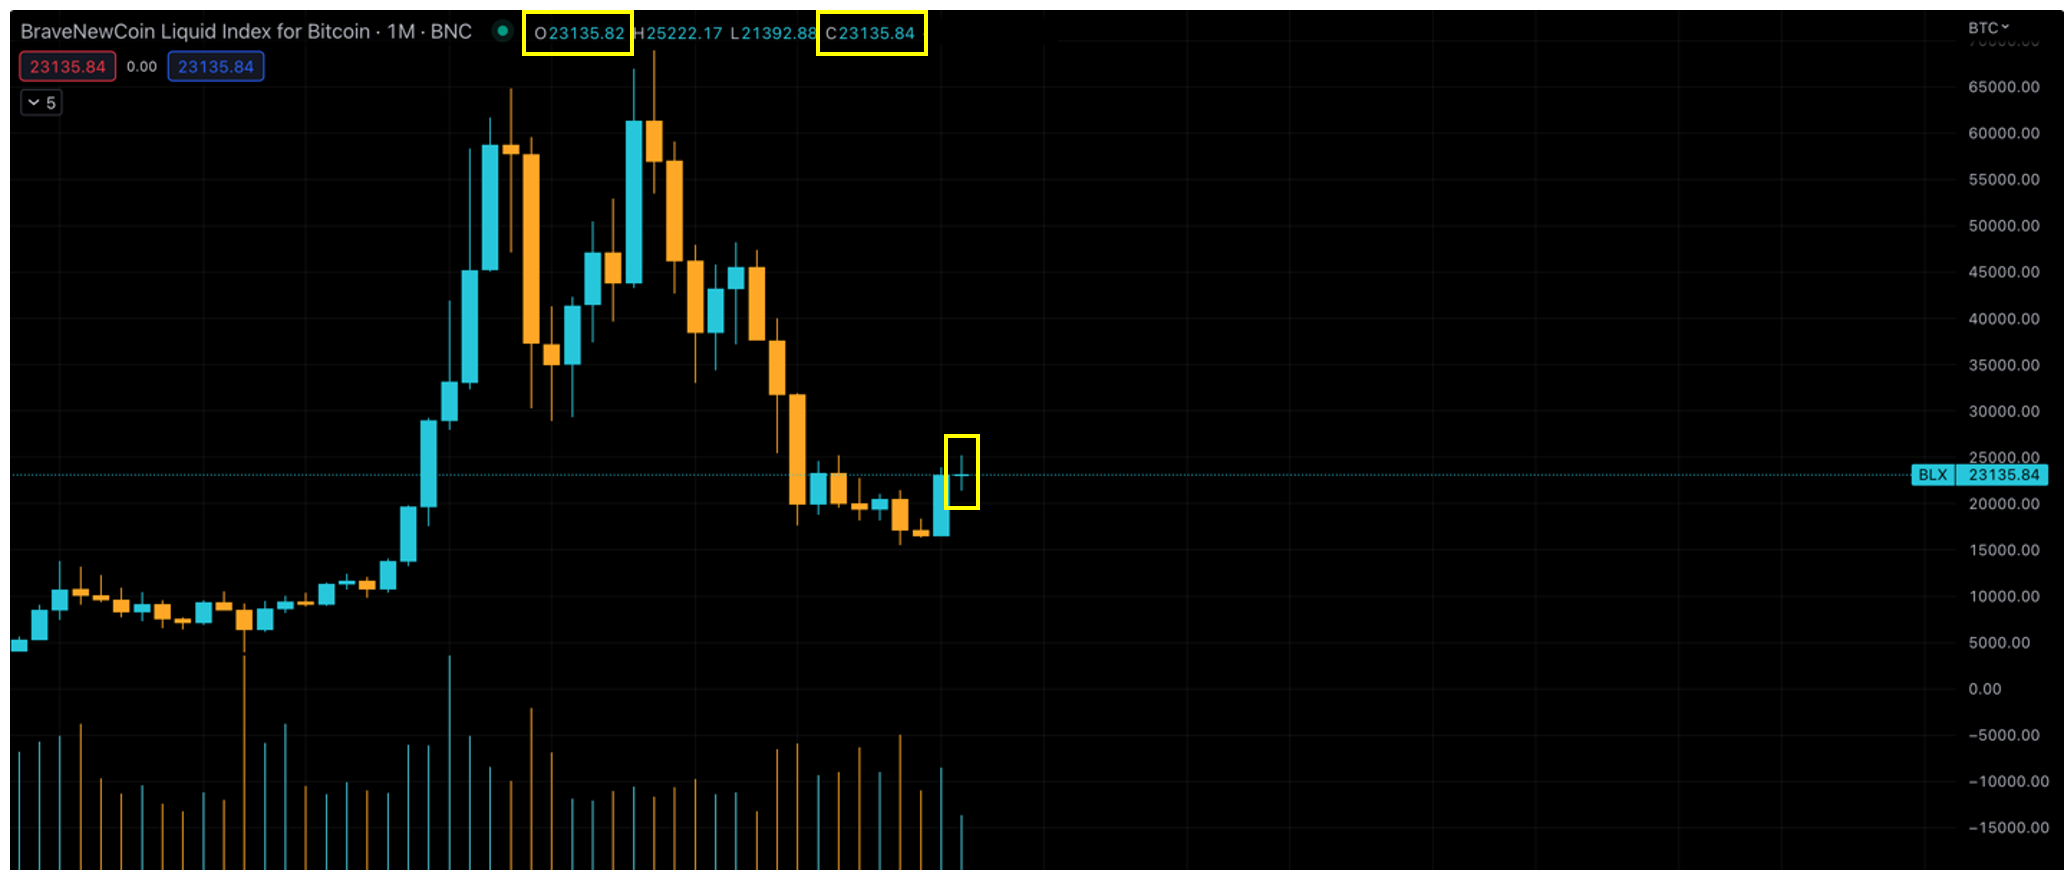
The month was far from placid, of course, with price reaching a low of $21,393 and a high of $25,222, a swing of nearly 18%. What’s even more incredible is that this trough-to-peak swing occurred over a mere three-day period (Feb 13-16). While I am by no means one to follow charts closely, it seems all but certain to me that such PA was orchestrated. The coincidence is simply too great. Just look at the monthly performance of BTC throughout its history:

February 2023 was literally the only time in BTC history that price finished flat for an entire month. Before this month, the least volatile monthly performance was -0.3%, which occurred in January 2017, and that was an outlier in itself. This month’s change was so microscopic that the percentage change must be calculated out to FIVE decimal places before it can even be detected (0.00009%). Long and short, I personally believe price was manipulated in February, and particularly going into the close. For whatever reason, enough whales decided February was going to end flat and it did.
The following chart may lend some insight into why at least some whales decided February should end flat:
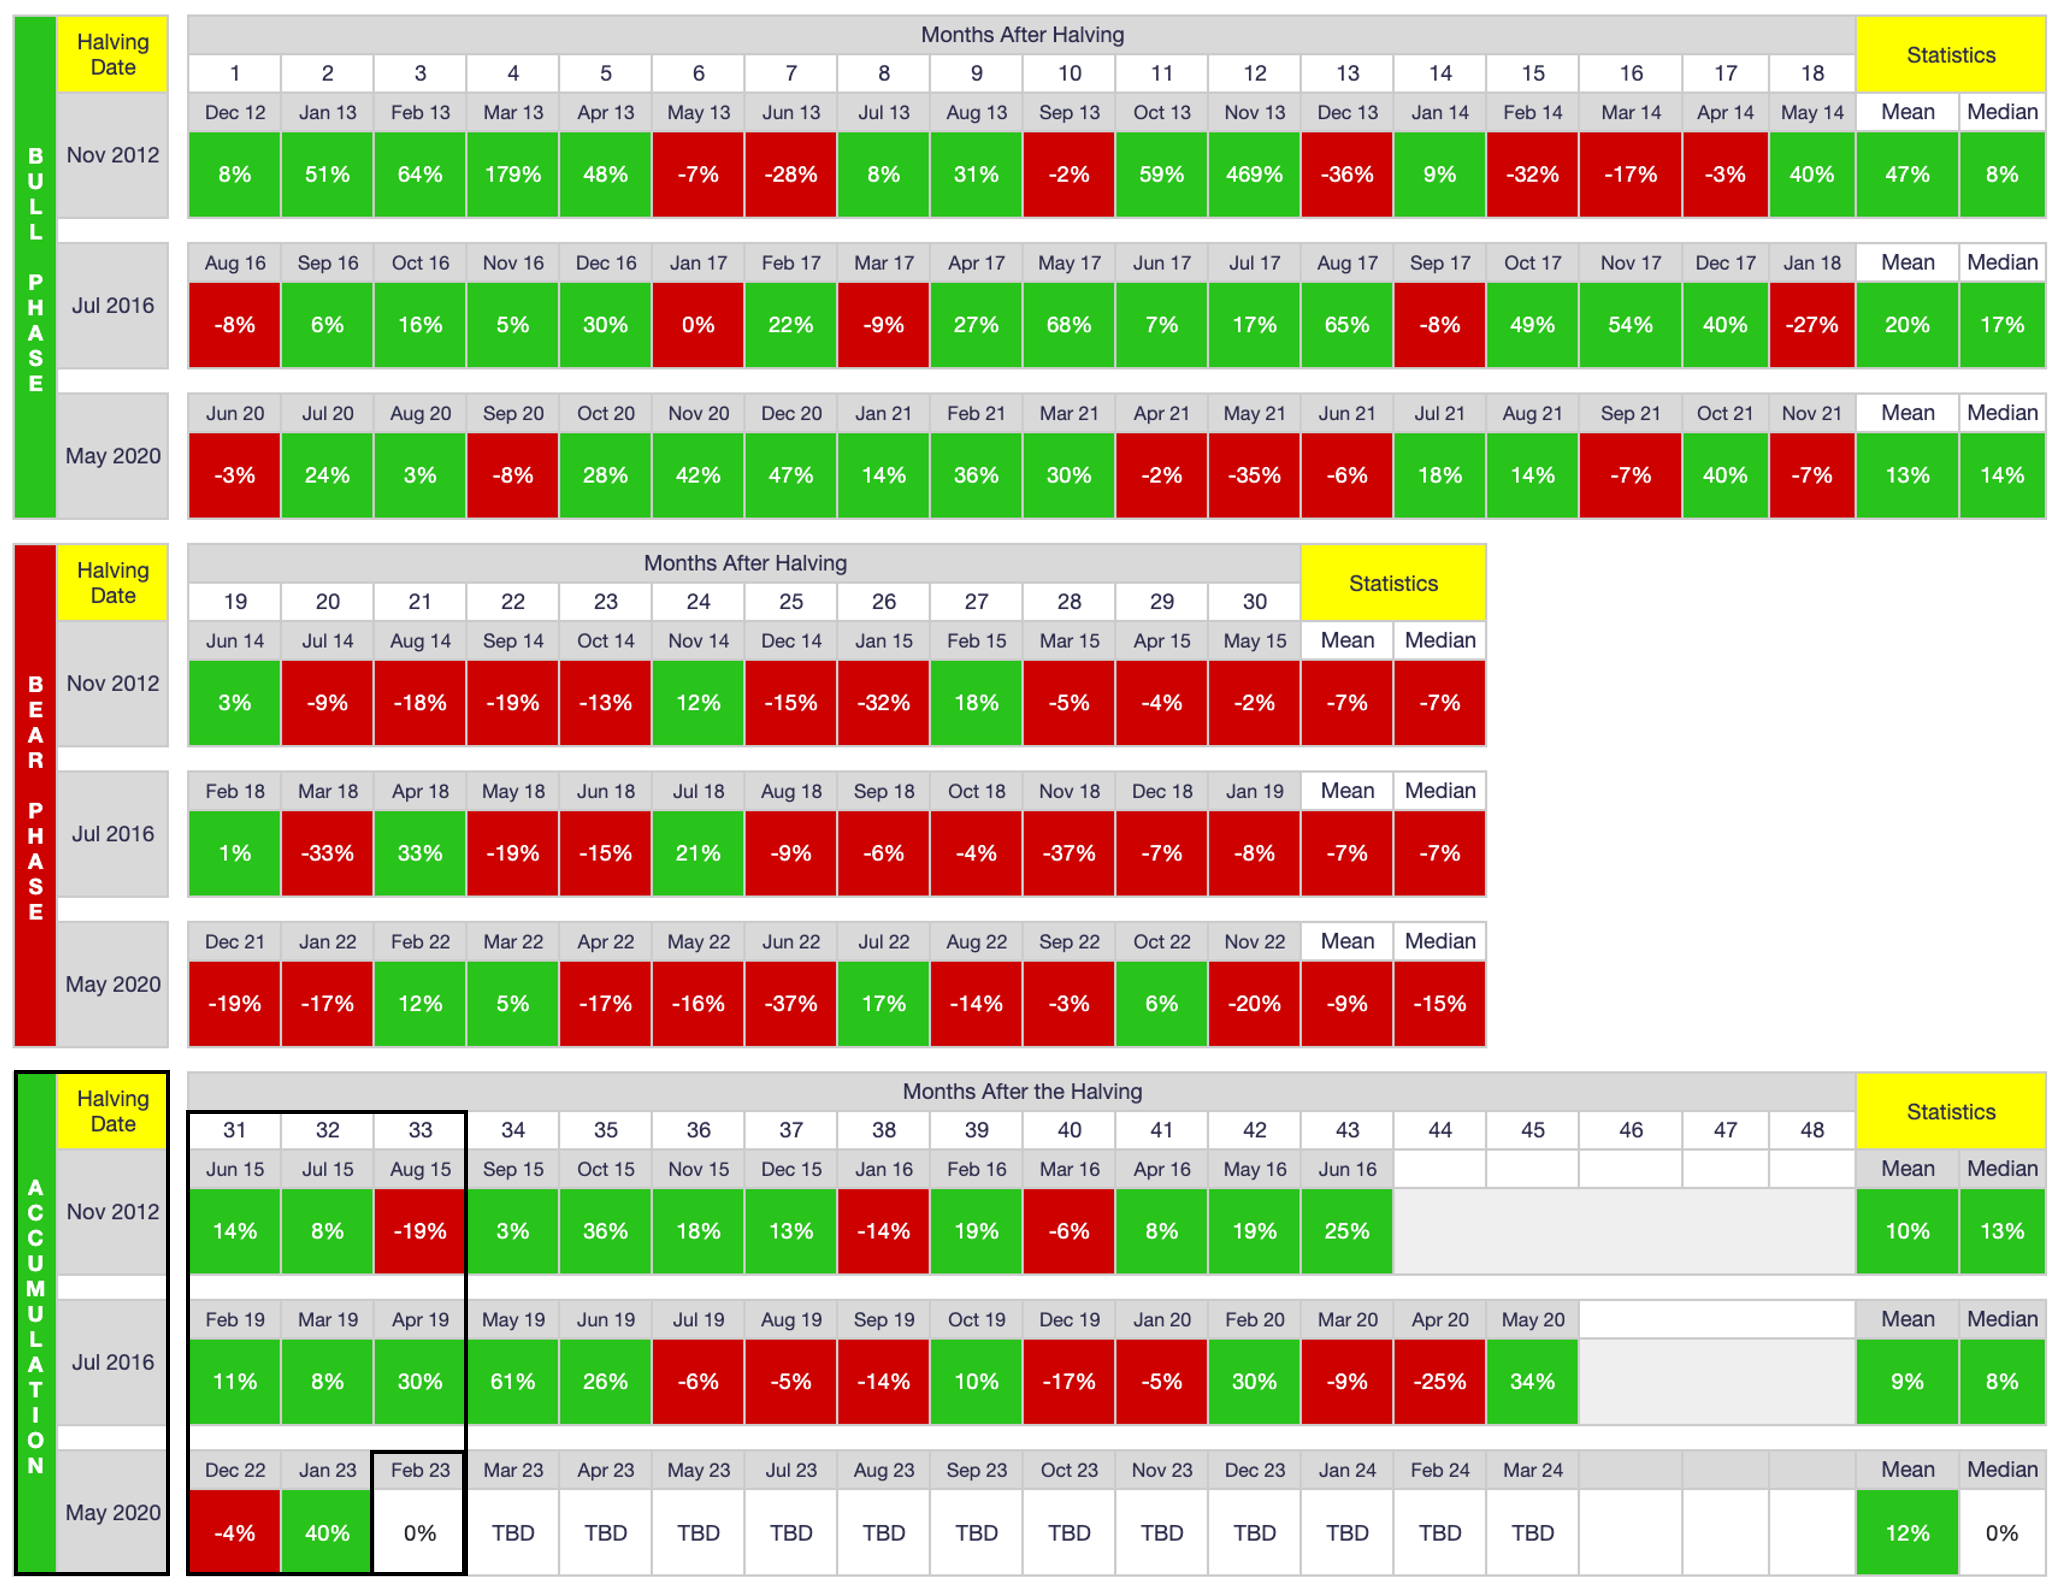
As shown above, February is the third month of the (re)accumulation phase for the current 4-year halving cycle. Because of the outsized rally in January (40%), it is possible some whales wanted to slow BTC’s roll before it picked up too much steam. Yes, I am fully aware the macroeconomy looms large over all markets right now, but it has also become clear, especially recently, that BTC’s PA is starting to decouple from other markets, most notably the Nasdaq (NDX).
I have been tracking the simple directional correlation of BTC and the NDX since January 3 of last year (the first trading day of 2022), and over that time, the two markets have had a directional correlation (both up or both down) 71% of the time. However, the correlation dropped to 67% in February and has been only 55% since February 13. Granted, this sample size is small, but my intuition has been confirmed. Decoupling has begun, for better or worse. The more important question, however, is how robust and long-lasting the decoupling will prove to be.
Whatever the case, it is clear from the on-chain data that the 45% bounce off the cycle low ($15.5K on November 21) has been primarily retail-driven:
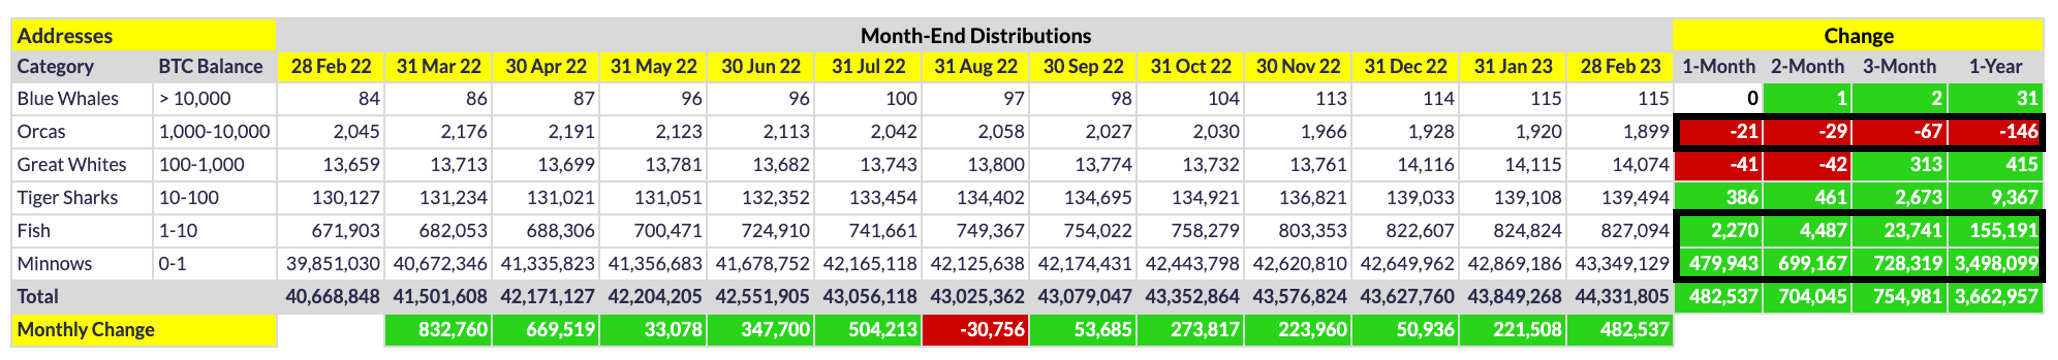
As shown above, Minnows in particular have been flooding into BTC over the past 12 months. The only hiccup during the exponential increase occurred last August. That 30.8K contraction aside, a staggering 3.5M new Minnow addresses have been created over the past 12 months, along with an equally impressive 155.2K new Fish.
On the flipside, as shown both above and below, Orcas have devolved nearly continuously over the past year and frankly even longer after accounting for the net-neutral wallet expansion by Grayscale on March 1, 2022 (they created +/- 130 new wallets that day).
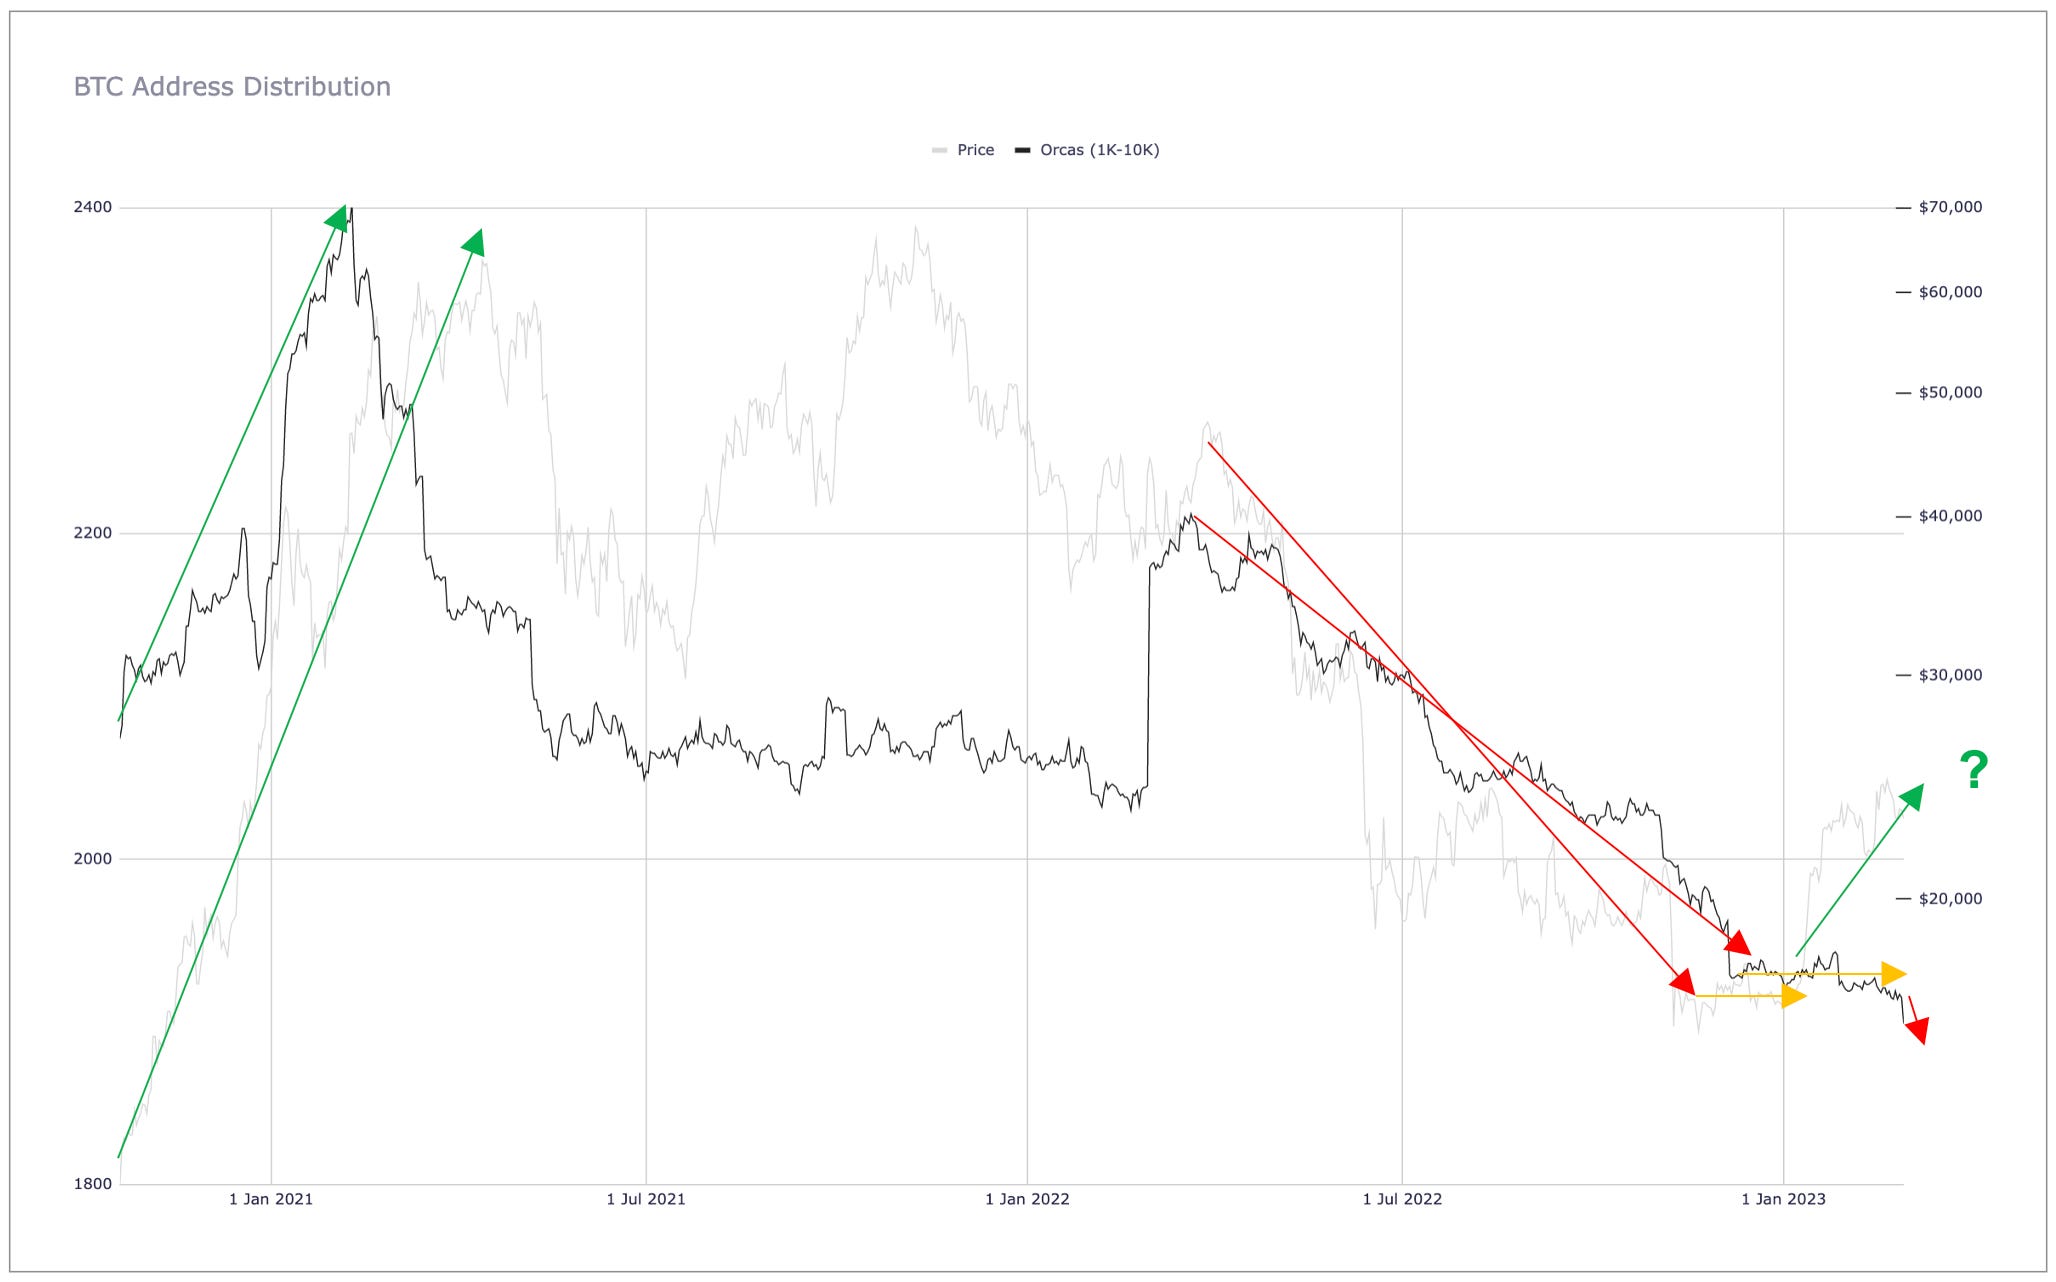
As shown above, and as I have argued for a long time (see here and here), Orca counts reliably predict PA. When they increase exponentially (like in late 2020), price skyrockets; but when they contract (as they have been for a year now), price collapses. As such, while I personally think the cycle low is in and we will not see prices as low as $16K again, the current rally does give me pause - it has occurred amidst flat Orca counts and in fact is now facing yet another severe Orca contraction. As such, I will not be the least bit surprised to see price roll over during March, particularly if Orca counts do not stabilize, and quickly.
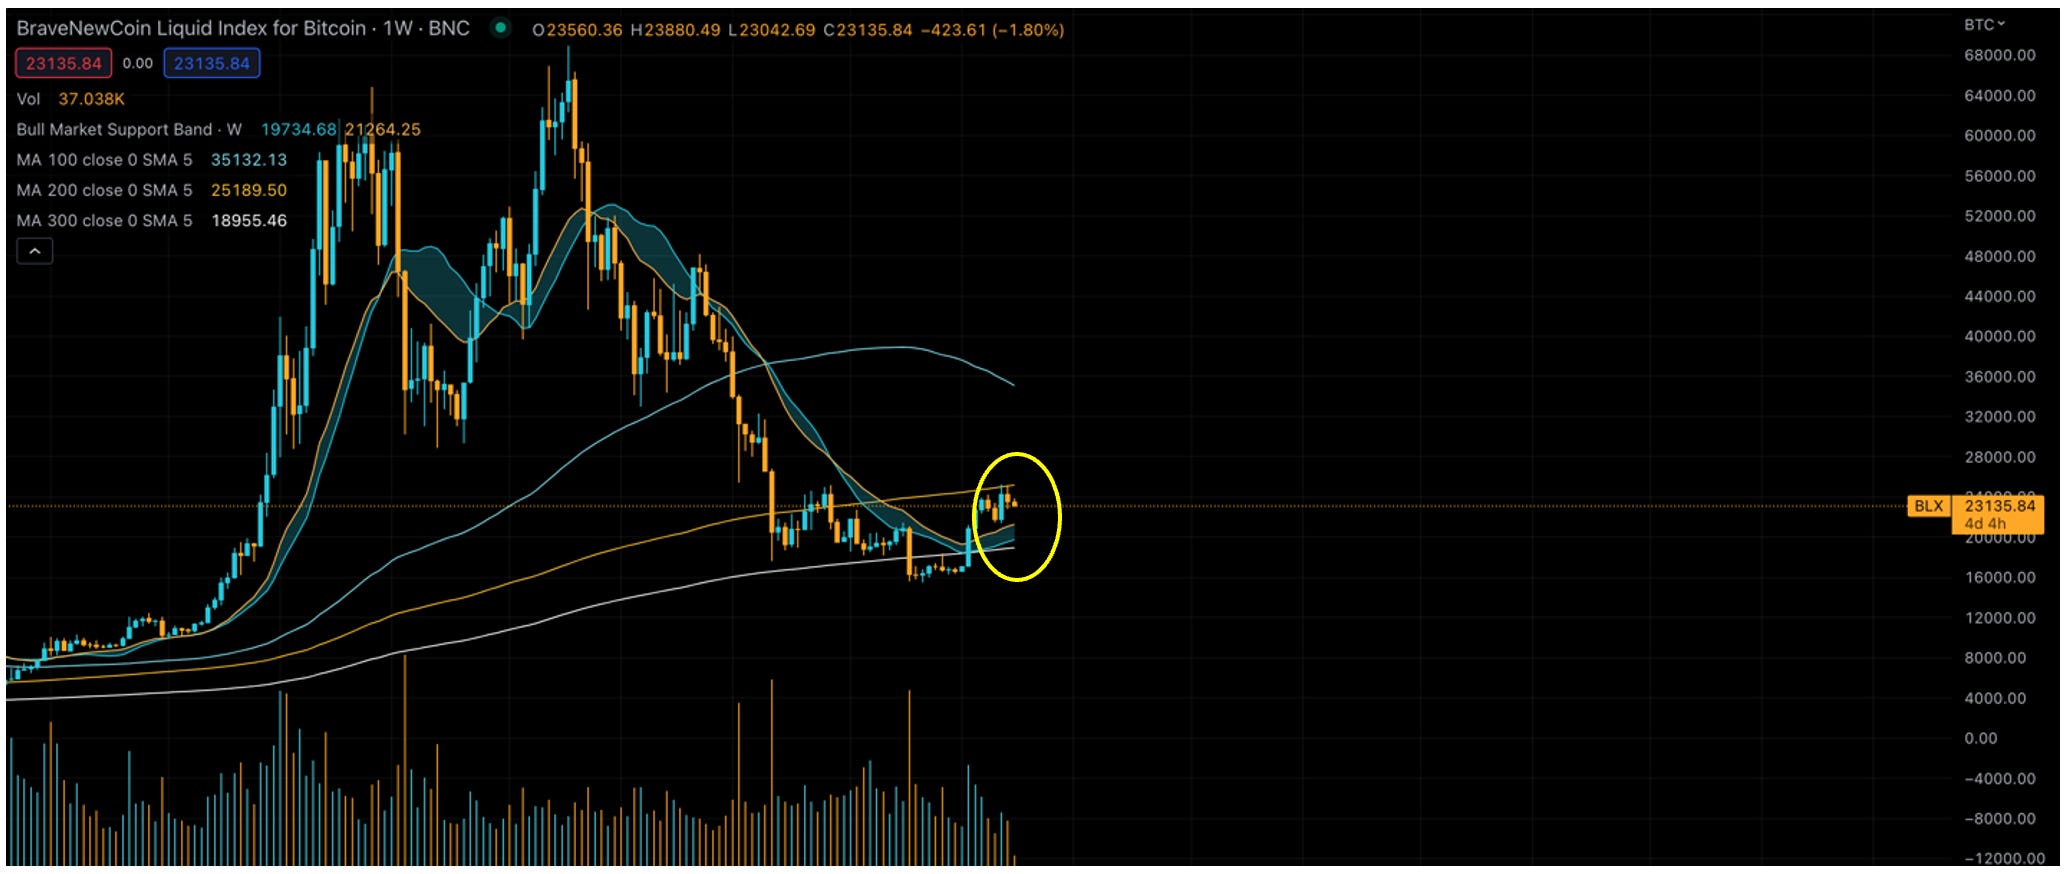
Although I am no advocate of technical analysis, I do fully believe in human psychology and its role in establishing price points that act as support and resistance. As such, it could easily be argued that price will pull back if for no other reason than to test the bull-market support band. As shown below, the support band currently sits around $20K (ranging from $19,734 to $21,264, depending on which weekly moving average is referenced):
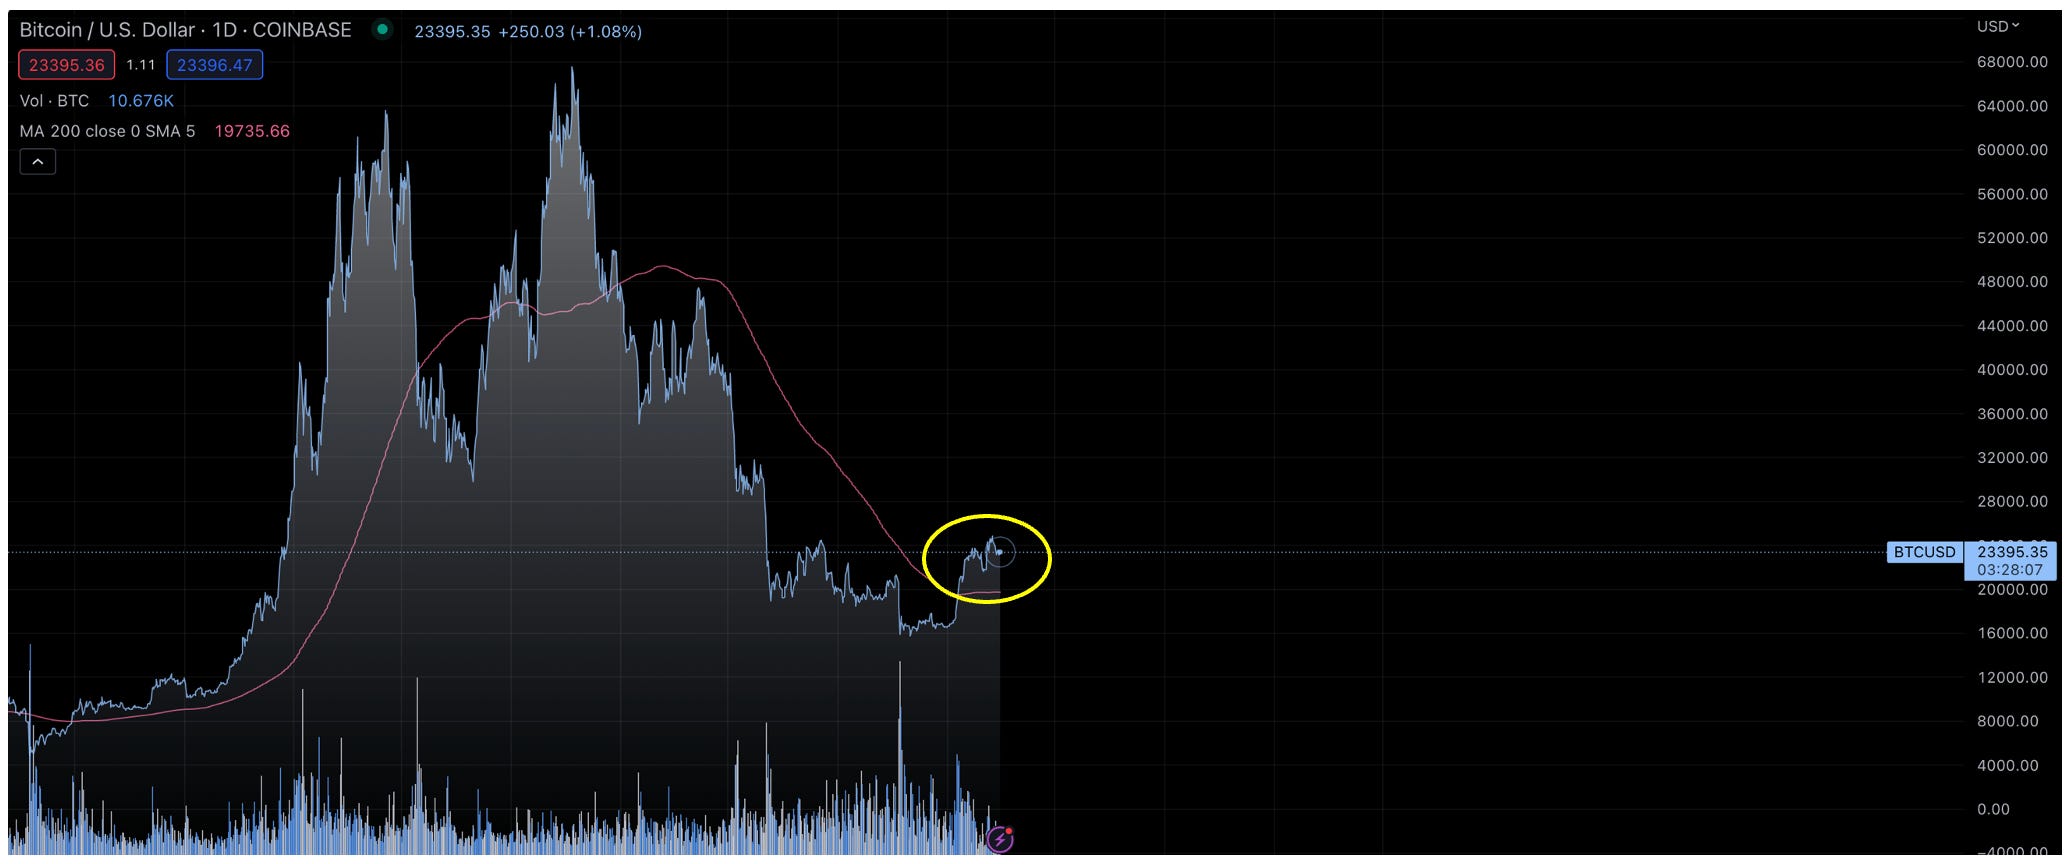
Somewhat coincidentally, the 200-day moving average is also at $19,735, so a retest of this popular moving average would also be a likely (if unpleasant) outcome:
From this perspective, or even strictly just from a human psychology perspective, it seems likely that price will eventually test $20K again, and likely during March unless Orcas start stepping up their game. Barring a macroeconomic meltdown, however, I actually think $20K will act as support if indeed tested, but that is based solely on my intuition, and lord knows my intuition has been wrong many times before. Still, the inflation/rate-hike narrative has run its course, in my opinion, as has the USD-strength narrative. Yes, a sudden spike in inflation (or rate hikes or the DXY) would undoubtedly create a headwind for BTC’s price, but only modestly and temporarily, in my opinion, as I am still a firm believer in the four-year cycle. As such, I think BTC will end up for the year, even if only modestly so. Moreover, I think the days of $16K BTC are permanently in the rear-view mirror. Again, barring macroeconomic disaster.
NB: All of this prognostication is only my opinion and should not be construed in any way as financial advice in any form.
On-Chain Data
I mentioned network addresses above with respect to the exponential increase in retail addresses and the somewhat alarming contraction of Orca addresses over the past 12 months, but below are more data that highlight an interesting divergence between addresses and coins during the month of February:
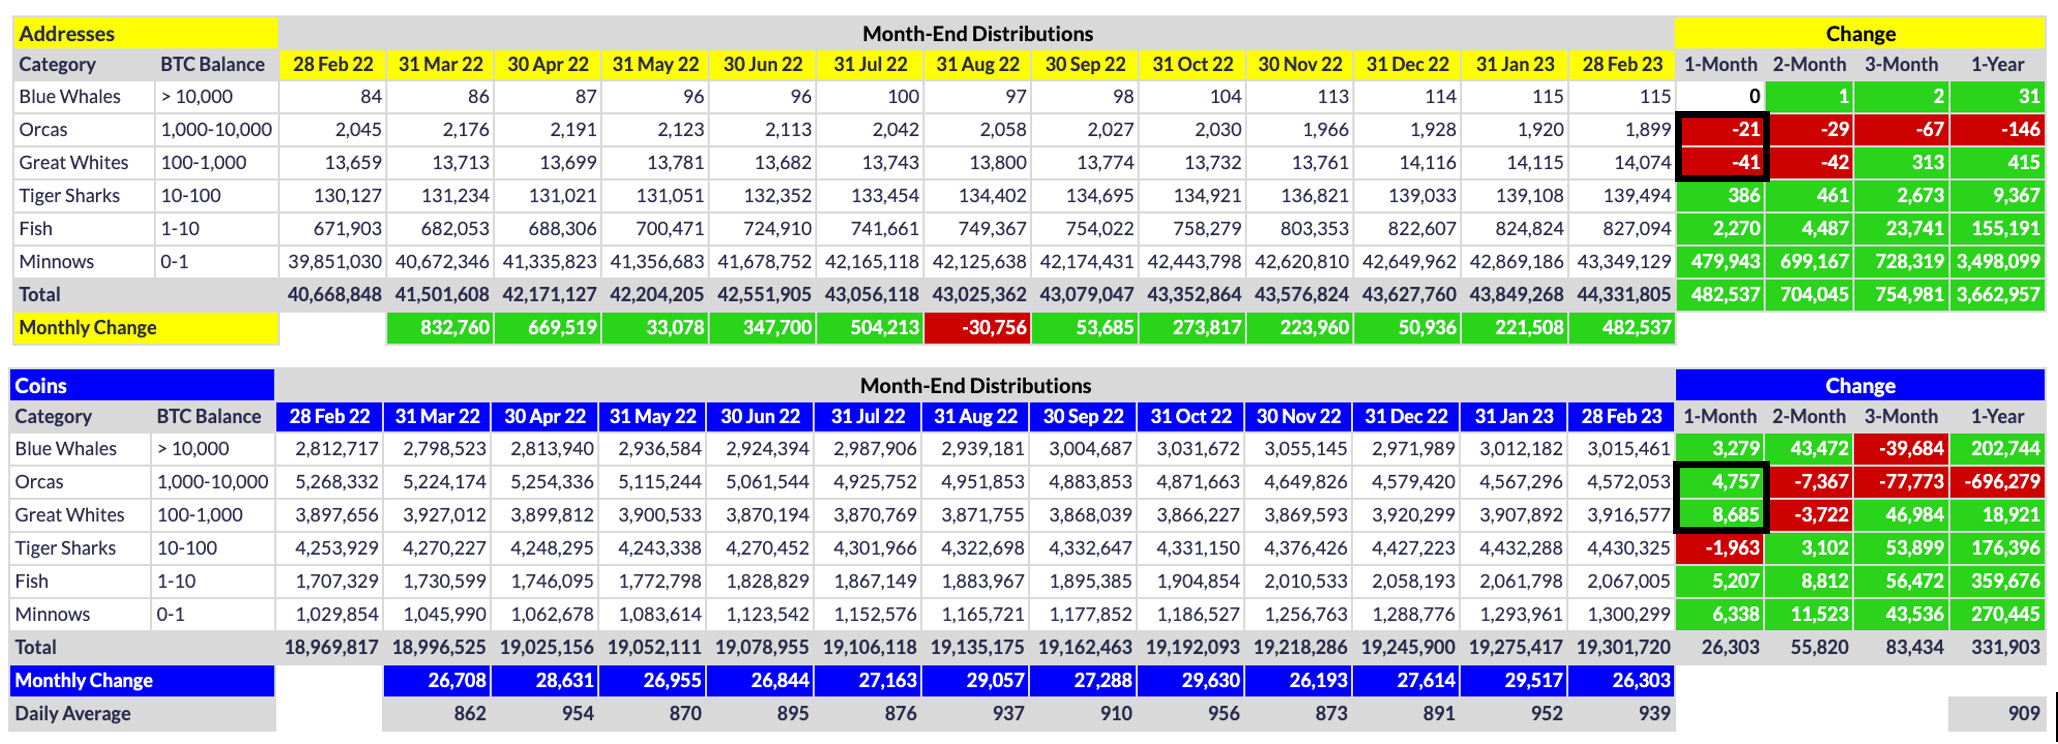
As shown above, despite a combined contraction of 62 Orca and Great White (GW) addresses during February, the tiers collectively added 13.4K coins to their coffers, which is over half the new coins mined during the month (13.4K of 26.3K). Such accumulation suggests to me that either remaining Orcas and GWs are doubling down on their bets or that some entities consolidated their holdings into fewer wallets. I am inclined to believe the former is more likely because wallet consolidation would likely push some wallets into the Blue Whale (BW) tier, and that in fact may be the case. However, I think the more likely/common scenario is that remaining Orcas and GWs added to their bags despite other members of their tiers devolving.
Whatever the case, such coin accumulation is one reason the current rally could sustain despite the severe address contraction, particularly among Orcas. That said, such coin accumulation would have to continue throughout March before I would begin to believe that the current rally could indeed be sustainable despite the severe contraction in addresses among Orcas, and to a lesser extent, the GWs.
One other on-chain chart of note is the exchange inventory for February. As I have tweeted recently in my daily distro updates, @coinglass.com exchange data have been erratic lately, but we can still get a sense of how exchange inventories have changed over the past few months.
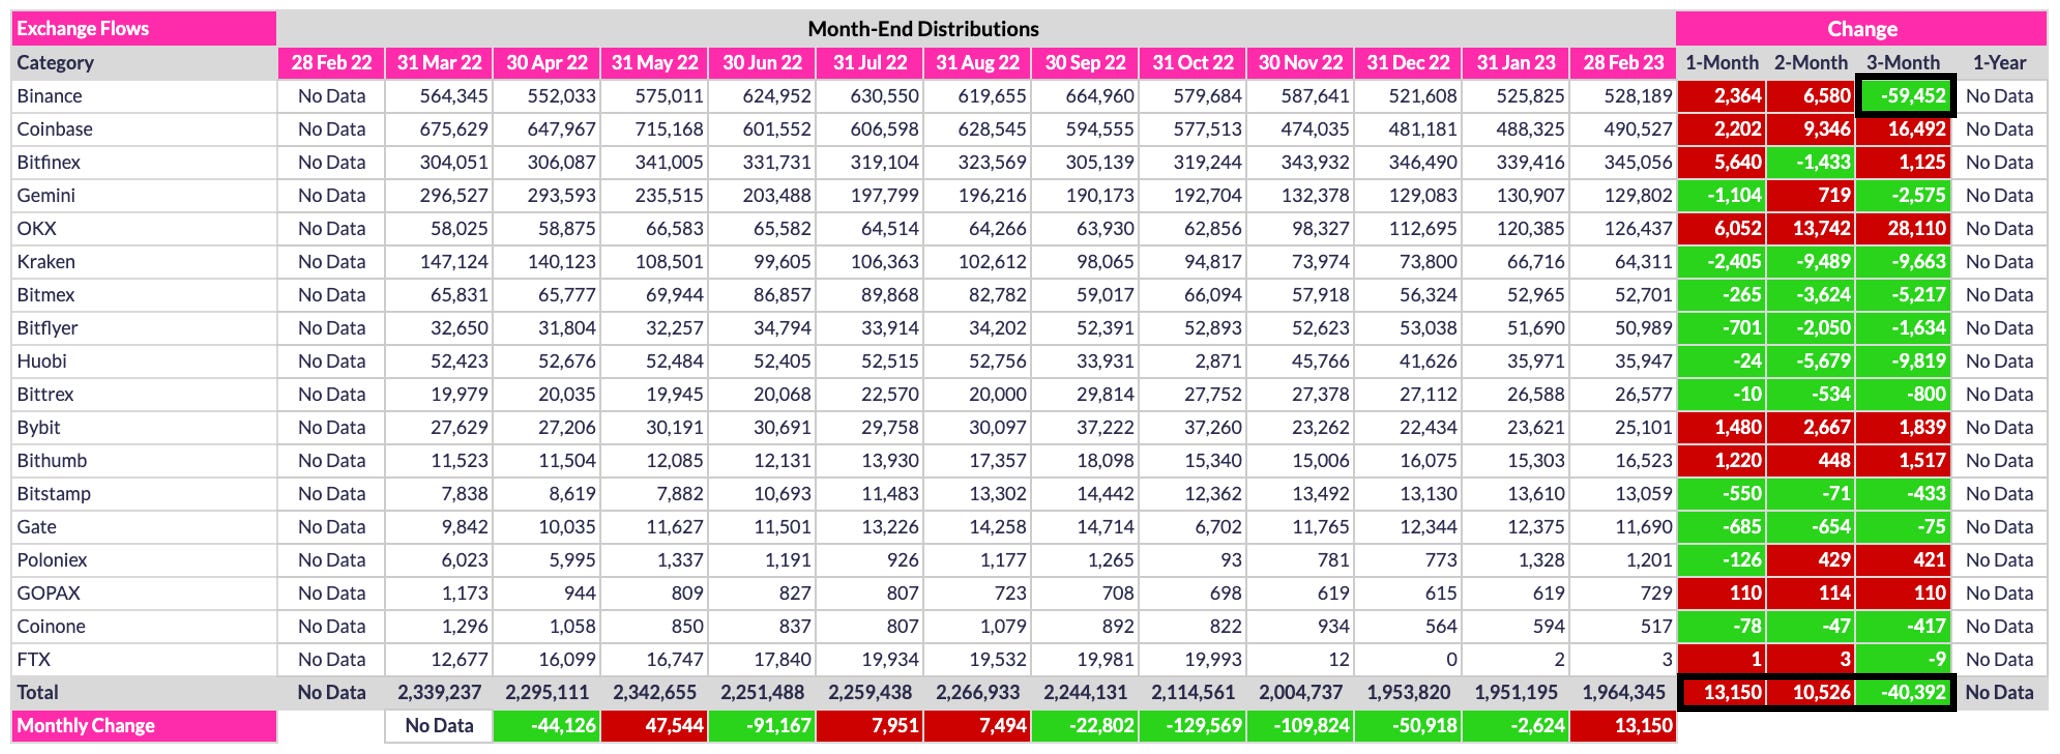
As shown above, 13.2K coins flowed into the listed exchanges during February. Normally, inflows are perceived as bearish, but given the centralized exchange (CEX) scare that surfaced late last year, it is understandable that at least some coins would find their way back onto exchanges after the scare subsided, and that is exactly what we have seen. As shown above, Binance in particular had a massive 59.5K outflow during December, with coins only now beginning to be redeposited onto that exchange. In fact, the three largest exchanges (Binance, Coinbase, Bitfinex) all had exchange inflows in February, as did OKX, which had the single largest inflow (6.1K coins). Still, exchange inventories combined experienced only a 0.6% increase during February, so such an inflow is essentially meaningless. That said, I do find it curious that FTX’s exchange wallet now has 3.06 BTC, up from 0 in December (after its collapse). Who in the world would have been depositing micro-amounts of BTC into that wallet over the past two months?
Conclusion
February 2023 was a fascinating if frustrating month in Bitcoinistan. Price tread lower the first half of the month, briefly raced 18% higher over a three-day period, and then got beaten back down the latter half of the month, only to close exactly two cents higher than where it opened. Pure manipulation, in my opinion, particularly the final few days of the month. But whether or not price was actually manipulated makes no difference long-term. What really matters is whether/when institutional investors start unequivocally reentering Bitcoin en masse. At these 5-figure USD price levels, only whales can purchase the number of coins necessary to move price substantially and sustainably, like we saw in late 2020 and early 2021. That said, retail buyers can move price substantially - if not sustainably - when there is a frenzy over a sufficiently short timespan. We witnessed such an event in summer 2021 as well as the 3x rally that occurred in the first half of 2019. As such, a similar rally is not out of the question now, provided of course institutional investors either stay on the sideline, or more importantly, do not rain coins upon retail heads every time there is a micropump in price (as has occasionally been the case recently).
Whatever the eventuality, I remain sanguine about BTC’s PA throughout 2023. I think it will be an up year overall (due to the 4-year halving cycle) and we could even see a 2019-like rally somewhere in the middle if, e.g., the Fed is forced to start printing and/or the DXY crashes below 100. While I would be pleased by the former outcome, I obviously would prefer the latter. And in that wish, I most certainly am not alone.
Go #BTC.