
Month-End Analysis

Disclaimer
The data I use (BitInfoCharts, Coinglass, CoinMarketCap) to compile the tables and graphs contained in the on-chain section of this analysis do not always align with data found via others sources like Glassnode and CryptoQuant. I cannot explain the reason for the differences nor can I confirm which sources are most accurate. For this and other reasons, I have come to trust only the on-chain data I collect when trying to explain and/or predict Bitcoin’s (BTC) future price action (PA). Whether you too find my on-chain analysis useful is for you to decide, but I can assure you some of my observations and/or predictions will differ, often markedly, from other observations and/or predictions you will see on Crypto Twitter (CT) and elsewhere.
Price Action
Despite my own ambivalence regarding what October PA may have in store for us (see my prediction last month), October 2023 most certainly lived up to its “Uptober” moniker. Opening the month at $26,965 (on BLX), price pretty much ascended the entire month, including a 10.2% daily candle on October 23. Price ended up peaking two days later at $35,115 before closing the month only slightly off the high at $34,661. When all was said and done, October closed up an impressive 28.5%, a full $7,700 higher than where it opened.
Below is a table of BTC’s calendar-month returns throughout its history:
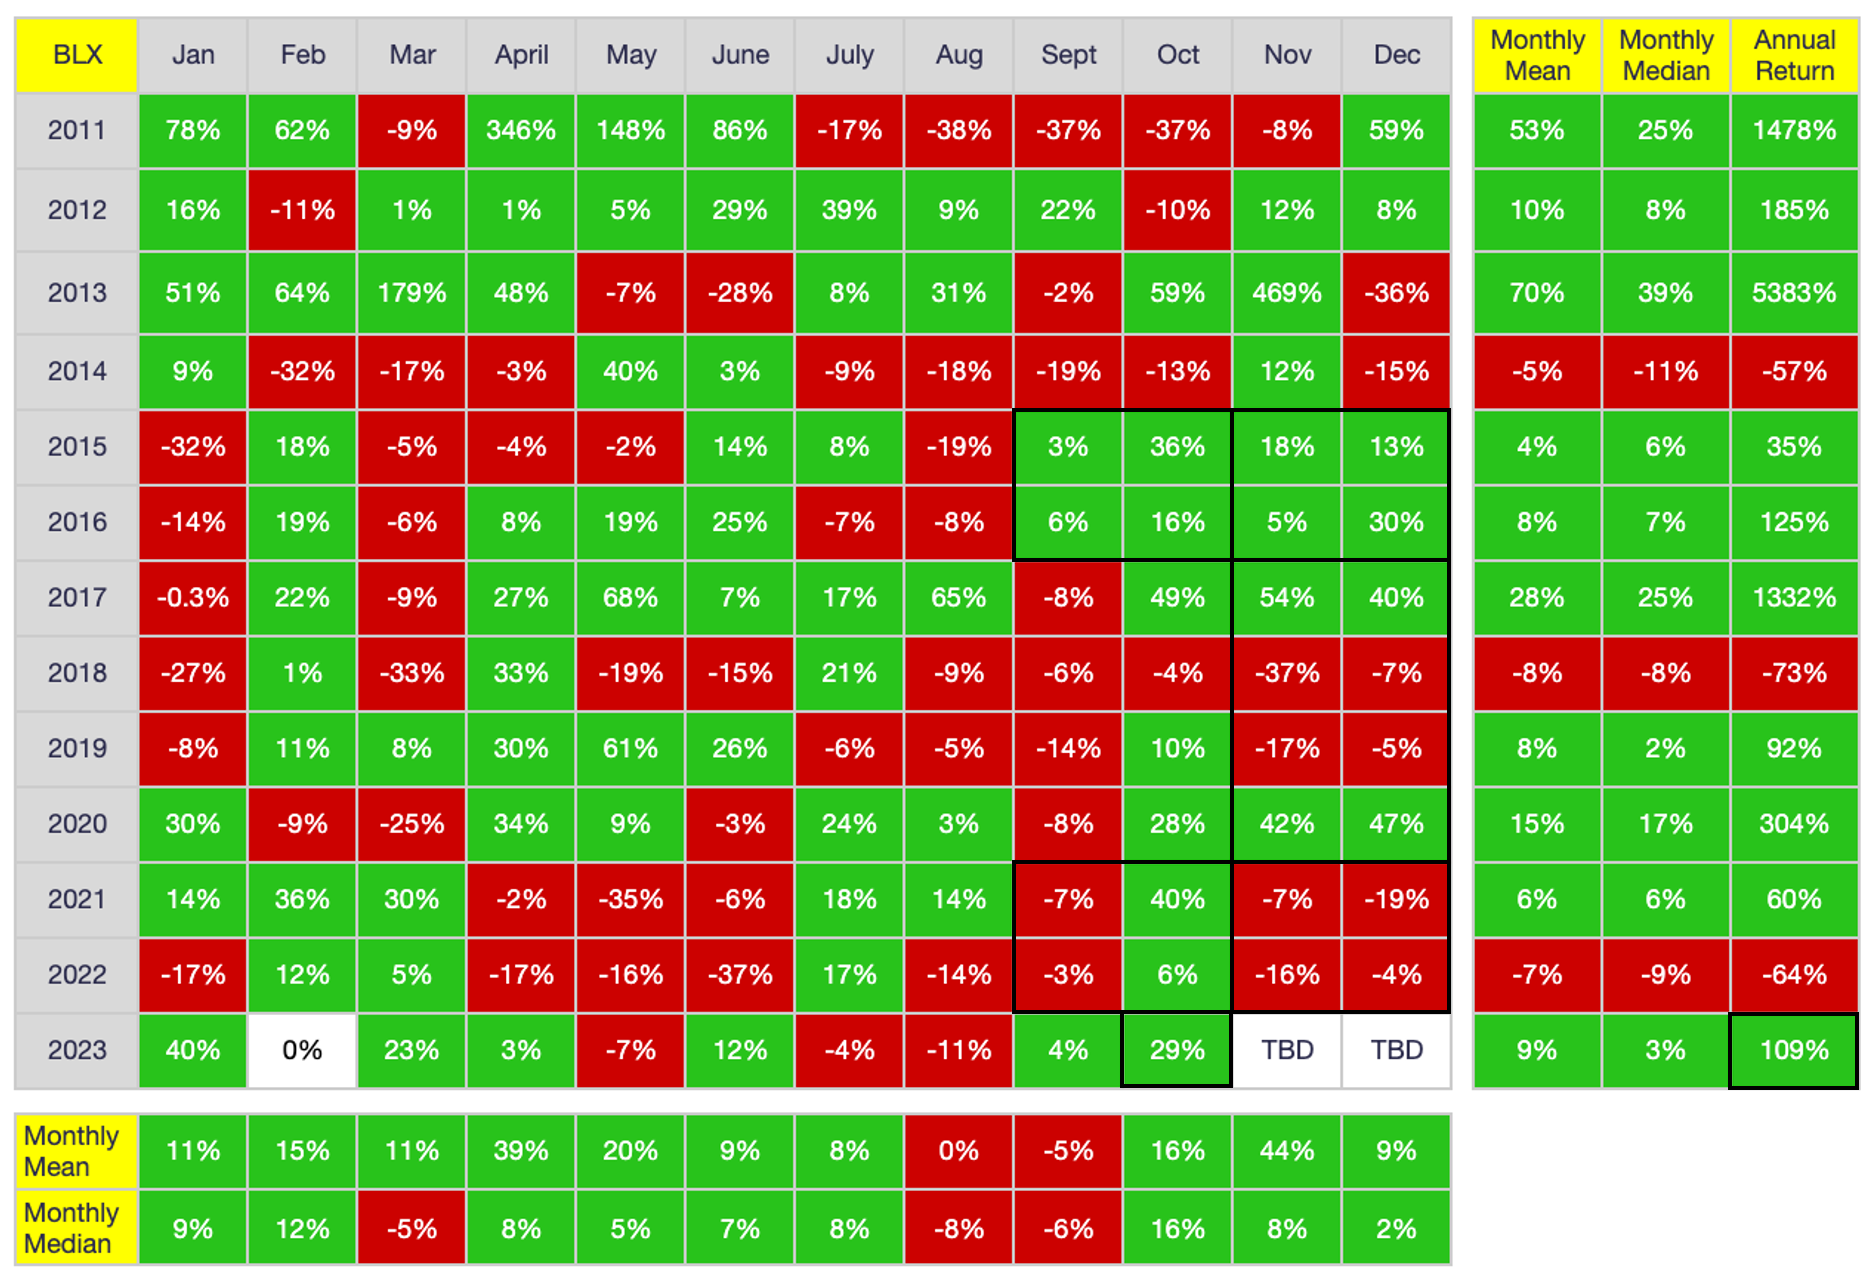
As shown above, October 2023’s near-29% return is the fifth highest October return in history, trailing only 2013 (59%), 2017 (49%), 2021 (40%) and 2015 (36%). Perhaps more impressive is the annual return year-to-date (YTD: 109%), making 2023 one of the strongest non-halving years in BTC’s history.
Without question, October 2023’s PA was impressive in every respect. The question is, what will happen in November? Looking at the data above, both a bullish case and a bearish case can be made. From a bullish perspective, note that when both September and October closed higher (in 2015 and 2016), so too did the subsequent November and December. On the other hand, November has closed lower four of the previous five years and has counter-traded October three of the previous four years, so one could easily argue November will close lower. That said, note also that November and December have traded in concert every year since 2015. In this light, if November closes higher, there is good reason to believe it will trade higher in December. On the flipside, if November trades lower, there is good reason to believe December will close lower. Like I said, there are compelling narratives for both the bears and bulls as we look ahead to November PA, at least in terms of calendar-month returns.
As I explained last month, historical PA suggests either Q4 2023 or Q1 2024 will trade lower, and my guess at the time was that Q4 2023 would trade lower given the fact that I had assumed one or more US spot-BTC Exchange Traded Funds (ETFs) would be approved early next year rather than later this year. Put another way, I anticipated Q1 2024 would be extremely bullish for BTC due to both ETF approval in January and the halving in April, so if one of the next two quarters were to close lower, Q4 2023 seemed the more likely candidate.
Unfortunately for my prediction, however, the probability that Q4 2023 will trade lower has dramatically decreased simply because October PA was so strong. i.e., Even if November and December were to close lower, Q4 is still likely to close higher overall given the 29% pump this month. Time will tell, of course, and anyone who has inhabited Bitcoinistan for more than a moment knows that anything is possible. All this said, there is still a case to be made for the bulls for the remainder of the year based solely on the rhythm of the halving cycle, which again I personally think has far more predictive validity than calendar-month returns per se. See the table below, reorganized according to the halving cycles rather than calendar years:
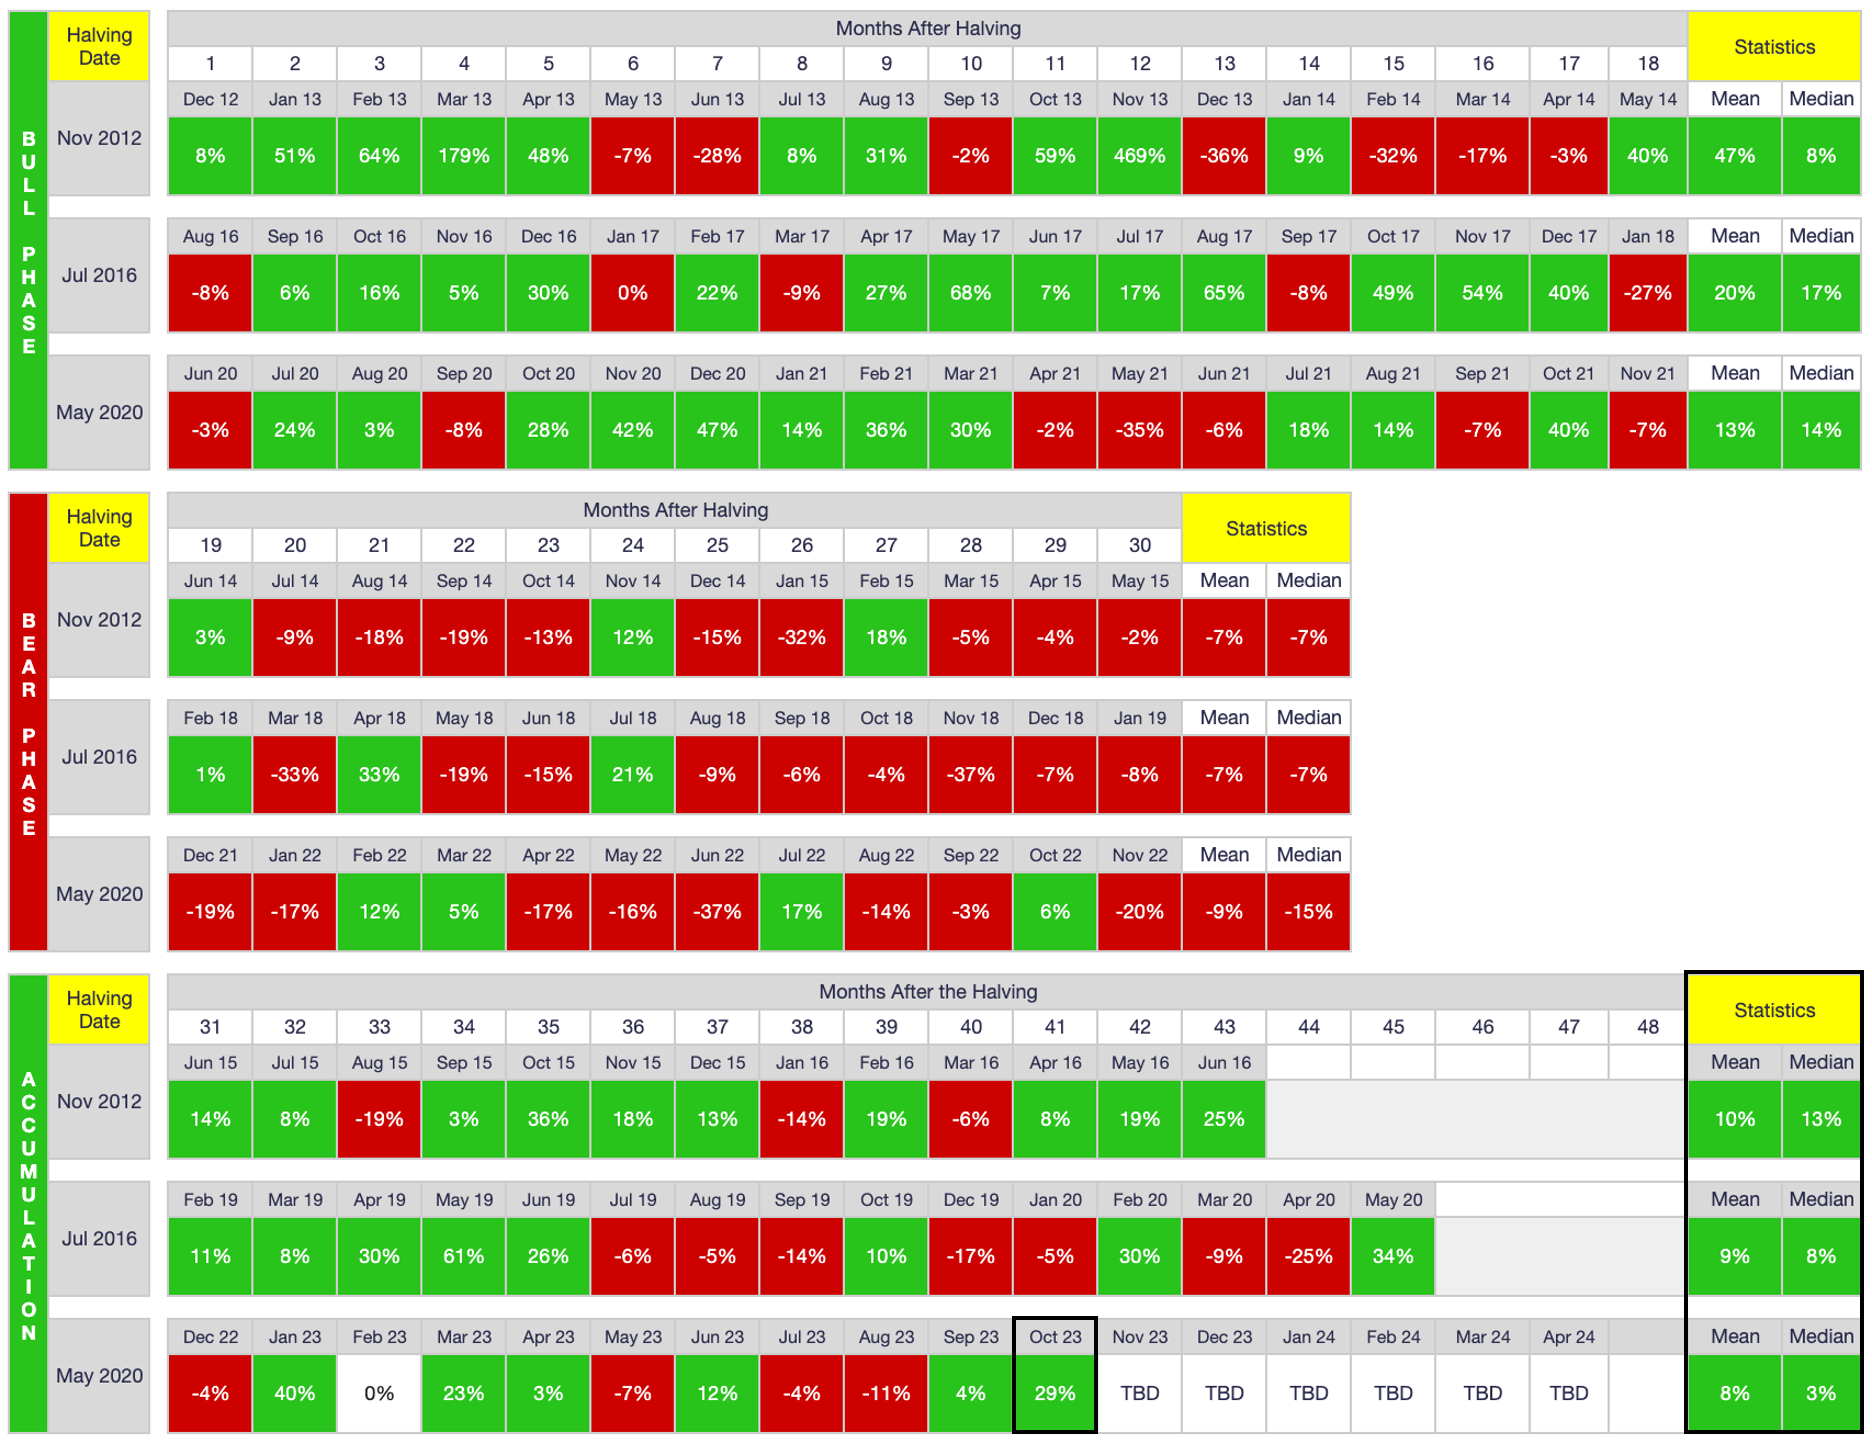
Note above the three halving-cycle phases I have identified: the bull phase (post-halving), the bear phase (post-euphoria), and the (re)accumulation phase (pre-halving). As shown, October 2023 is the 41st month following the previous halving (which occurred in May 2020), with six months remaining before the next halving (projected to occur in April 2024).
Also as shown, the (re)accumulation phase of each halving cycle skews more bullish than bearish but is still littered with bearish months throughout. Because the last down month for this accumulation phase occurred in August, it is entirely possible November will close red. On the other hand, I have argued for quite a while that this cycle more resembles the 2012-2016 cycle than the 2016-2020 cycle. In this light, it is entirely possible this cycle will conclude on a decidedly bullish note, such that three (or even four) consecutive green months is not out of the question. In other words, both November and December 2023 could print green and still adhere to the rhythm of the halving cycles, particularly if this cycle more resembles the PA of the 2012-2016 cycle rather than the 2016-2020 cycle (which is logical given the black-swan pandemic event that tanked all markets in March 2020).
All this said, I personally still lean more bearish than bullish for the remainder of the year simply because price does not monotonically increase, especially during the accumulation phase of the halving cycle. The only thing I can foresee that would alter my forecast is the approval of one or more US spot-BTC ETFs before year-end, which I discuss below in more detail. Short of ETF approval, however, I do think price will cool off a bit in November and possibly also in December (NB: none of my forecasts should be construed as investment advice; they are merely a reflection of my personal opinion based on BTC’s historical PA).
On-Chain Data
Below are the distribution of BTC addresses and coins for the past 12 months:

As shown, October exhibited a clear demarcation between institutional and retail investors. Both whale tiers and the Great Whites experienced address expansion while the Tiger Sharks, Fish and Minnows all experienced contractions. The same is true for coin accumulation, although the Orcas experienced a net coin loss due to the very strong accumulation by the Blue Whales (BWs). While I philosophically prefer more decentralization in terms of coin distribution, there is no denying that the price of BTC benefits when institutions are in accumulation mode as they are now.
When analyzing BW counts vis-à-vis price, it is clear the two are strongly inversely correlated, as shown below. i.e., BWs typically accumulate during price swoons and sell during price pumps. This pattern was consistent throughout this halving cycle and reinforces the stereotype that Big $ = Smart $.

Note above the seeming anomaly of the past 30 days, however (at the far right of the figure): BWs increased by four in October but price also pumped nearly 29%. This positive correlation in fact is not an anomaly and is actually quite bullish. i.e., What is not shown in the figure above is the BW expansion that occurred during Q3 and Q4 2020, when BWs increased by 12 (from 97 to 109) as price increased from $6K to $20K.
In other words, BWs do in fact increase early in each bull phase, which is what helps drive price higher initially. It is not until later in the bull phase that BWs begin to take profit. In other words, the current positive correlation between BW count and price appreciation seems to indicate the start of a new bull run. It is only later, when they begin contracting again, that we should start to look for a local top in price (although, to be clear, price can/will run MUCH higher before it peaks: In the 2020-2021 bull run, price peaked at $65K on April 13, 2021, which was more than 3X the price and five months after BWs began contracting in late November 2020).
The biggest reason price was able to continue appreciating so much and for so long after BWs began contracting in late 2020 was the aggressive Orca expansion that occurred in late 2020 and early 2021.
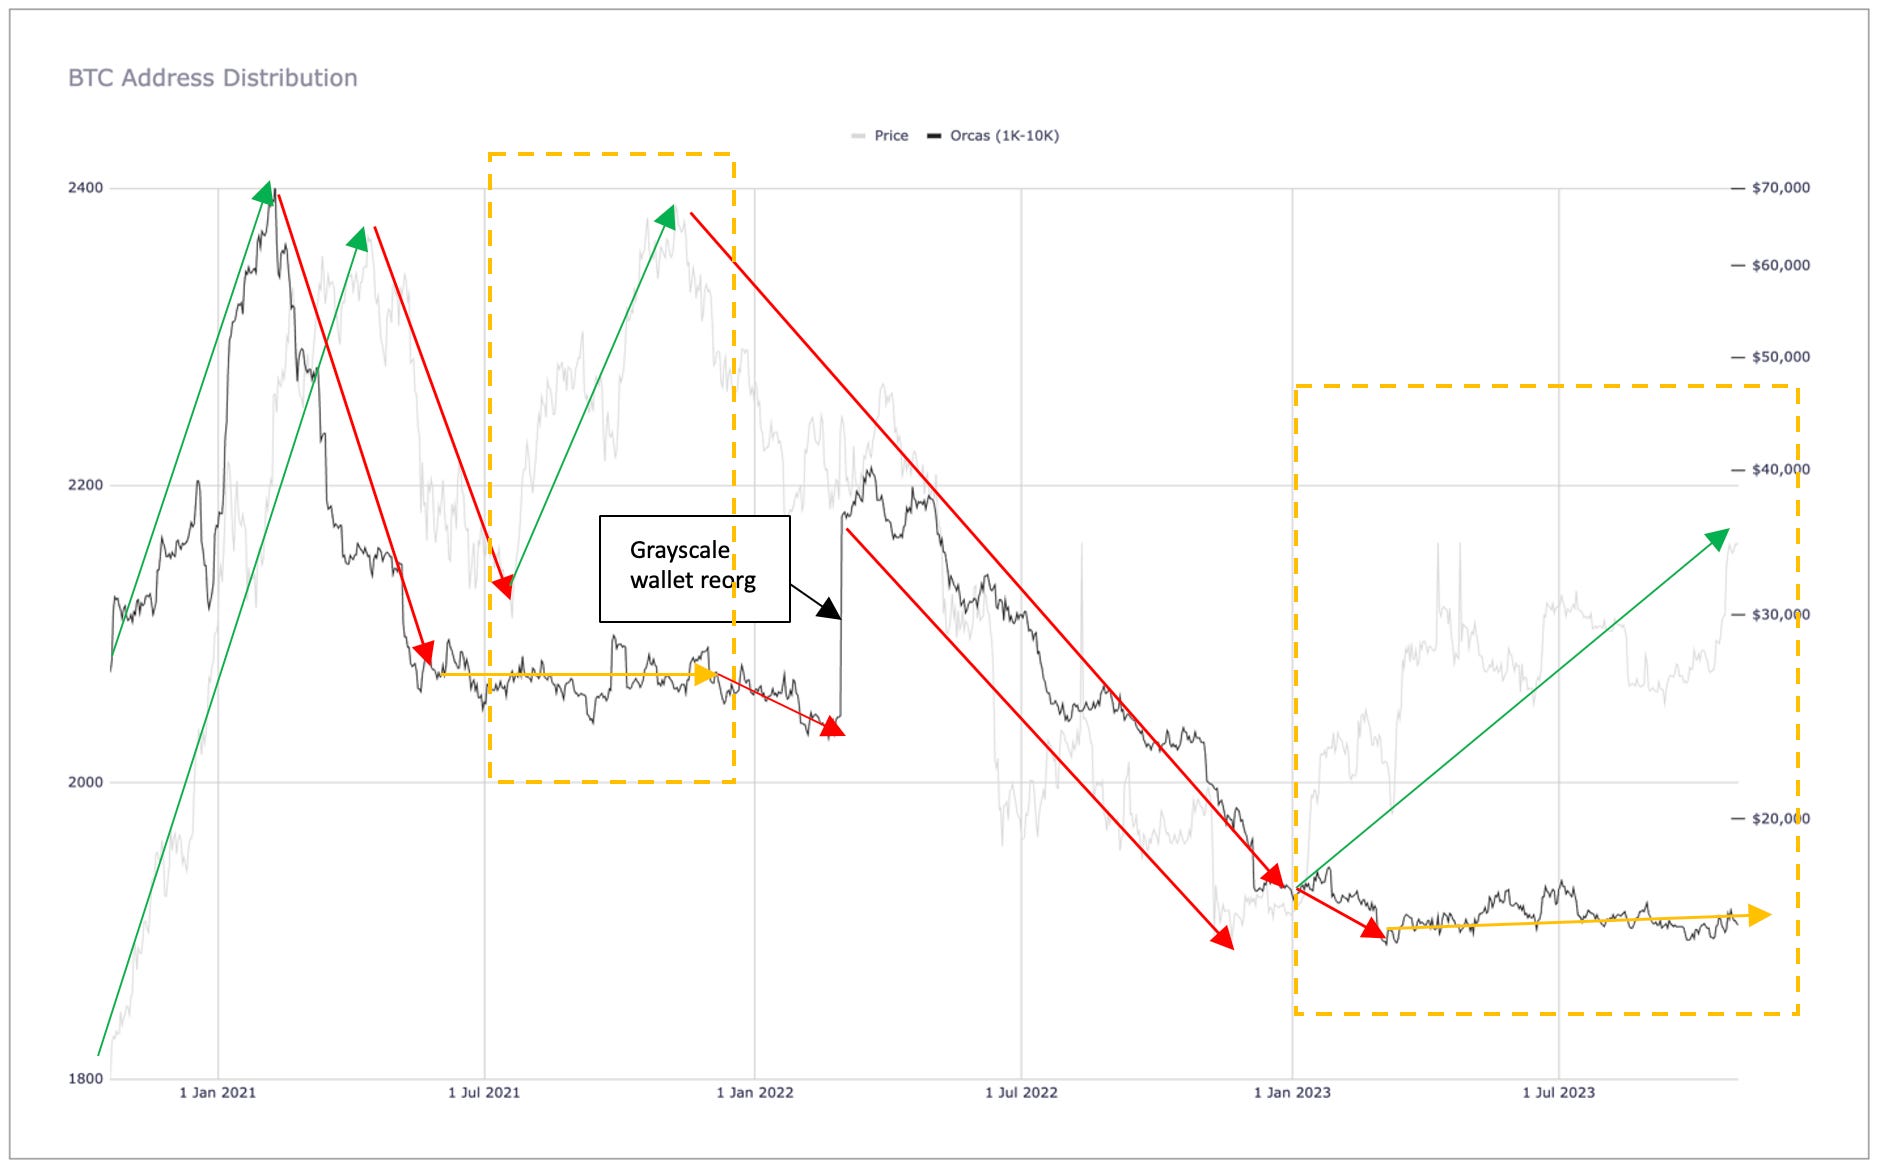
As shown above, Orcas expanded by a staggering 330 between October 2020 and their peak on February 9, 2021 (peaking at 2,403), which is what enabled the incredible price pump from $20K to $65K before it rolled over on April 14, 2021. In other words, while BW counts tend to inversely correlate with price except at the start of new bull runs, Orcas dictate PA for the majority of both bull runs and bear swoons.
As I explained here and here, Orca trends seem to have the greatest predictive validity with respect to future PA, greater than any other single indicator. It is for this reason that we bulls need to temper our near-term expectations. i.e., Despite the bullishness of recent BW increases, Orcas counts have been dead flat for all of 2023, which suggests to me that the current price pump is on shaky ground. While I do not necessarily think a faceplant is imminent, neither would I be surprised if price pulls back between now and the time that US spot-BTC ETFs are approved (and launched). More on this topic later. In the meantime, note that this flatlining of Orcas in 2023 is the biggest reason I lean bearish for November and possibly also December.
In sum, while the rhythm of the halving cycle suggests either Q4 2023 or Q1 2024 will close lower, so too does the flatlining of Orca counts. Yes, BW increases are bullish, but w/Orcas remaining on the sideline, it is unreasonable to expect additional substantial and sustainable price pumps until US ETFs are approved. Put another way, I personally won’t become an unmitigated price bull until I see Orca counts substantially increase like they did in late 2020 and early 2021.
Below are the BTC inventories for listed exchanges over the past 12 months:
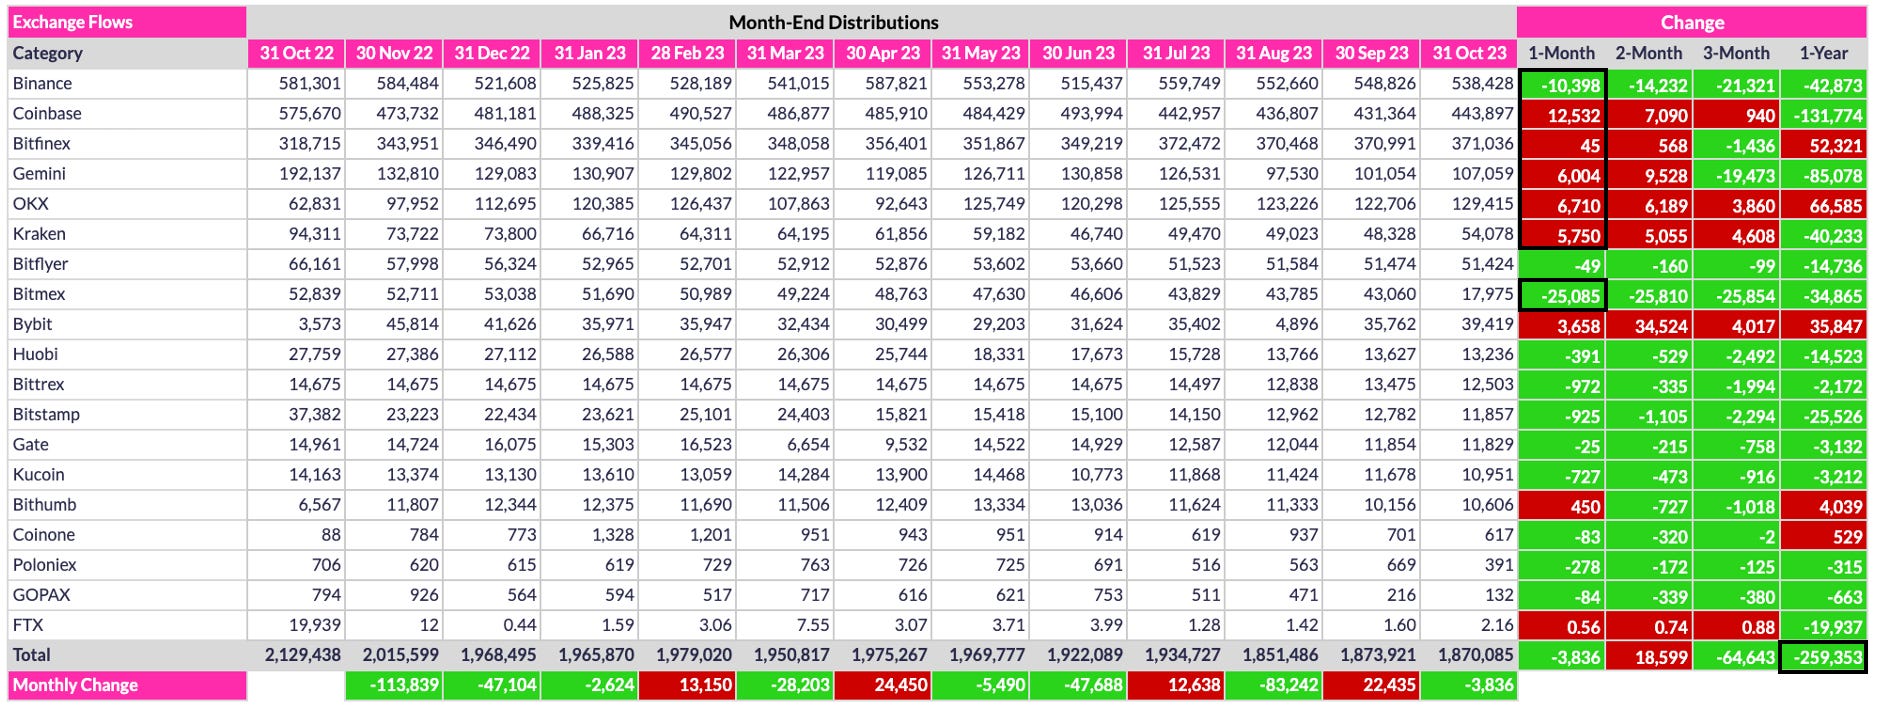
As shown above, there was a modest exchange outflow in October (3,836 coins), but the majority of those outflows were from Bitmex and Binance, whereas most other major exchanges had inflows, particularly the US-based exchanges (Coinbase, Gemini, Kraken). This inventory distribution as a whole is neither bullish nor bearish per se, but it is interesting that non-US whales were the most active in terms of outflows whereas US-based whales loaded up on US exchanges, presumably in preparation for eventual sale. The question of course is when/at what price.
One other highlight of note above is the 259.4K outflow over the past 12 months, representing 12.2% of the total exchange inventory. At that rate of outflow, exchanges would be devoid of coins in about eight years. Whether they run out of coins in eight years or not, that day is eventually coming and I for one cannot wait to watch the market panic that ensues when it does.
US Spot-BTC ETF Approval
Before I conclude, I want to share my thoughts on the seemingly inevitable approval of one or more US spot-BTC ETF applications:
Based on Steve McClurg’s thought process on Preston Pysh’s excellent recent podcast, it seems more probable than not that the US Securities and Exchange Commission (SEC) will simultaneously approve multiple ETF applications by mid-November (before the US Thanksgiving holiday week, which is the fourth week of November). Following approval, launches usually occur within 75 days, meaning the approved ETFs would likely open for trading in late January. Note, however, that Alex Thorn of Galaxy Digital pointed out on the Bankless podcast that many potential broker/dealer platforms will not be ready for trading upon ETF launch. Some make take up to several months to ramp up, so even if approved ETFs launch in January, a lot of potential inflows could be delayed for several months. So, what does this mean for near-term PA? Here is my best guess:
ETF approval will occur in 2023, either mid-November or early December.
Until then, price will drift higher as bullish narratives continue to emerge (e.g., new ETF tickers appear on the DTCC website, Larry Fink makes another “BTC is a flight to quality” comment on CNBC, etc.).
Price will collapse ~5% shortly after ETF approval - the rumor is currently being bought; the news will be sold.
Price will start to recover a few weeks hence, leading up to the launch in January.
Price will spike higher immediately following the launch as billions of USD begin flowing into the ETFs. In fact, I think total inflows might even exceed many expectations due to Capitalism 101. i.e., As many as a dozen ETFs could be approved simultaneously, and given how important “first-mover” advantage is, each of the approved issuers will be marketing their ETFs like mad, all trying to grab as much of the pie as they can in an effort to become market leader. This could drive tremendous money into the ETFs as a whole due to the intense competition among the approved ETFs.
Whatever the total initial intake, I think price will begin to retrace once the initial excitement wanes. Price will then find a new (higher) equilibrium, with price returning to choppy mode leading into and through the next halving in April.
The next full-on bull run will commence Q4 2024, much like it did in Q4 2020.
In light of my predictions above, I must reverse my predictions from last month, instead predicting that Q4 2023 will close higher and Q1 2024 lower (if indeed one of the two quarters must close lower at all, as I contend is necessary based on the rhythm of each halving cycle).
It must also be said that any major global-macro event would impact BTC’s price, at least in the short-term, although I am now a firm believer that more people view BTC as a risk-off asset rather than risk-on asset, which is to say that any macroeconomic strife would likely push BTC’s price higher rather than lower. Time will tell if this paradigm shift has indeed taken hold, but I think it has, and its likelihood is even greater if any global-macro meltdowns occur after US ETFs launch.
My predictions aside, Digital Galaxy’s analysis (as presented by Alex Thorn) forecasts a 74% price appreciation within 12 months of ETF launch based on whatever the price is at the date of launch. Interestingly, he states clearly in the Bankless podcast referenced above that the 74% price appreciation ignores any current frontrunning because the investor candidate pool for the ETFs differs from those investing now. As optimistic as that position seems, it is defensible, in my opinion. Let’s hope he/they are correct.
Conclusion
October was an incredible month for PA if not for on-chain data per se. While recent BW expansion is unquestionably bullish, Orca counts remain flat and volume is still relatively low. As such, current price is vulnerable to pullbacks, at least more so than during full-on bull runs. It is for these reasons I skew more bearish than bullish leading into November. That said, US ETF approval is the biggest potential price catalyst for BTC since Tesla bought $1B of BTC in early 2021. As such, the timing of ETF approval is all that matters right now in terms of PA. While we wait, price remains susceptible to slipping, in my opinion, especially if ETF approval is delayed until 2024. Then again, if Steve McClurg is correct, we will see approval within two weeks, as incredible as that seems. Whatever the eventuality, November will undoubtedly being an exciting month, and I for one have my popcorn at the ready.
Go #BTC.
Excellent summary David, I always look forward to your no-nonsense reports for a grounded perspective on things.