
Month-End Analysis

Disclaimer
The data I use (BitInfoCharts, Coinglass, CoinMarketCap) to compile the tables and graphs contained in the on-chain section of this analysis do not always align with data found via others sources like Glassnode and CryptoQuant. I cannot explain the reason for the differences nor can I confirm which sources are most accurate. For this and other reasons, I have come to trust only the on-chain data I collect when trying to explain and/or predict Bitcoin’s (BTC) future price action (PA). Whether you too find my on-chain analysis useful is for you to decide, but I can assure you that some of my observations and/or predictions will differ, often markedly, from other observations and/or predictions you will see on Crypto Twitter (CT) and elsewhere.
Price Action
Bitcoin’s price opened December at $17,169 (on BLX) and managed to climb as high as $18,355 (on the back of a cooling US inflation report) before resuming its all-too-familiar downtrend, ending the month at $16,533, just off the monthly low of $16,325. When all was said and done, BTC fell 3.7% in December to close out the second-worst year in its twelve-year history (second only to 2018):

As shown above, the “every fourth year is a down year” trend is firmly intact, with 2014, 2018 and 2022 all closing markedly lower. The good news of course is that the subsequent three years following 2014 and 2018 all closed higher, so there is at least some reason for optimism heading into 2023 regardless of the macroeconomic gloom that continues to envelop global financial markets.
That said, there are some troubling differences between the PA of 2022 and the respective PA of 2014 and 2018, which suggest this time might actually be different. For example, as shown below, 2022 marks the first time in BTC’s history that price closed lower in all four calendar-year quarters:

In fact, as shown above, BTC had closed lower in three consecutive quarters only once in its history (Q3 2019 - Q1 2020) before closing lower in all four quarters of 2022. The silver lining is that price closed down only 1% and 3% in Q1 and Q3 2022, respectively, both quarters that easily could have closed higher rather than lower. Moreover, 2018’s lone green quarter closed only 3% higher, so there isn’t too much cause for alarm with respect to this new precedent being set.
On the other hand, as shown below, BTC’s down years in 2014 and 2018 were preceded by huge up years in 2013 and 2017:

As shown above, BTC closed a staggering 5,383% higher in 2013 and 1,332% higher in 2017 vs. “only” 60% higher in 2021. In other words, a respective 57% and 73% drop in 2014 and 2018 were warranted after such monstrous preceding years, whereas a 64% drop following a 60% up year is less explicable.
Unfortunately, BTC PA has also started bucking another long-term trend:
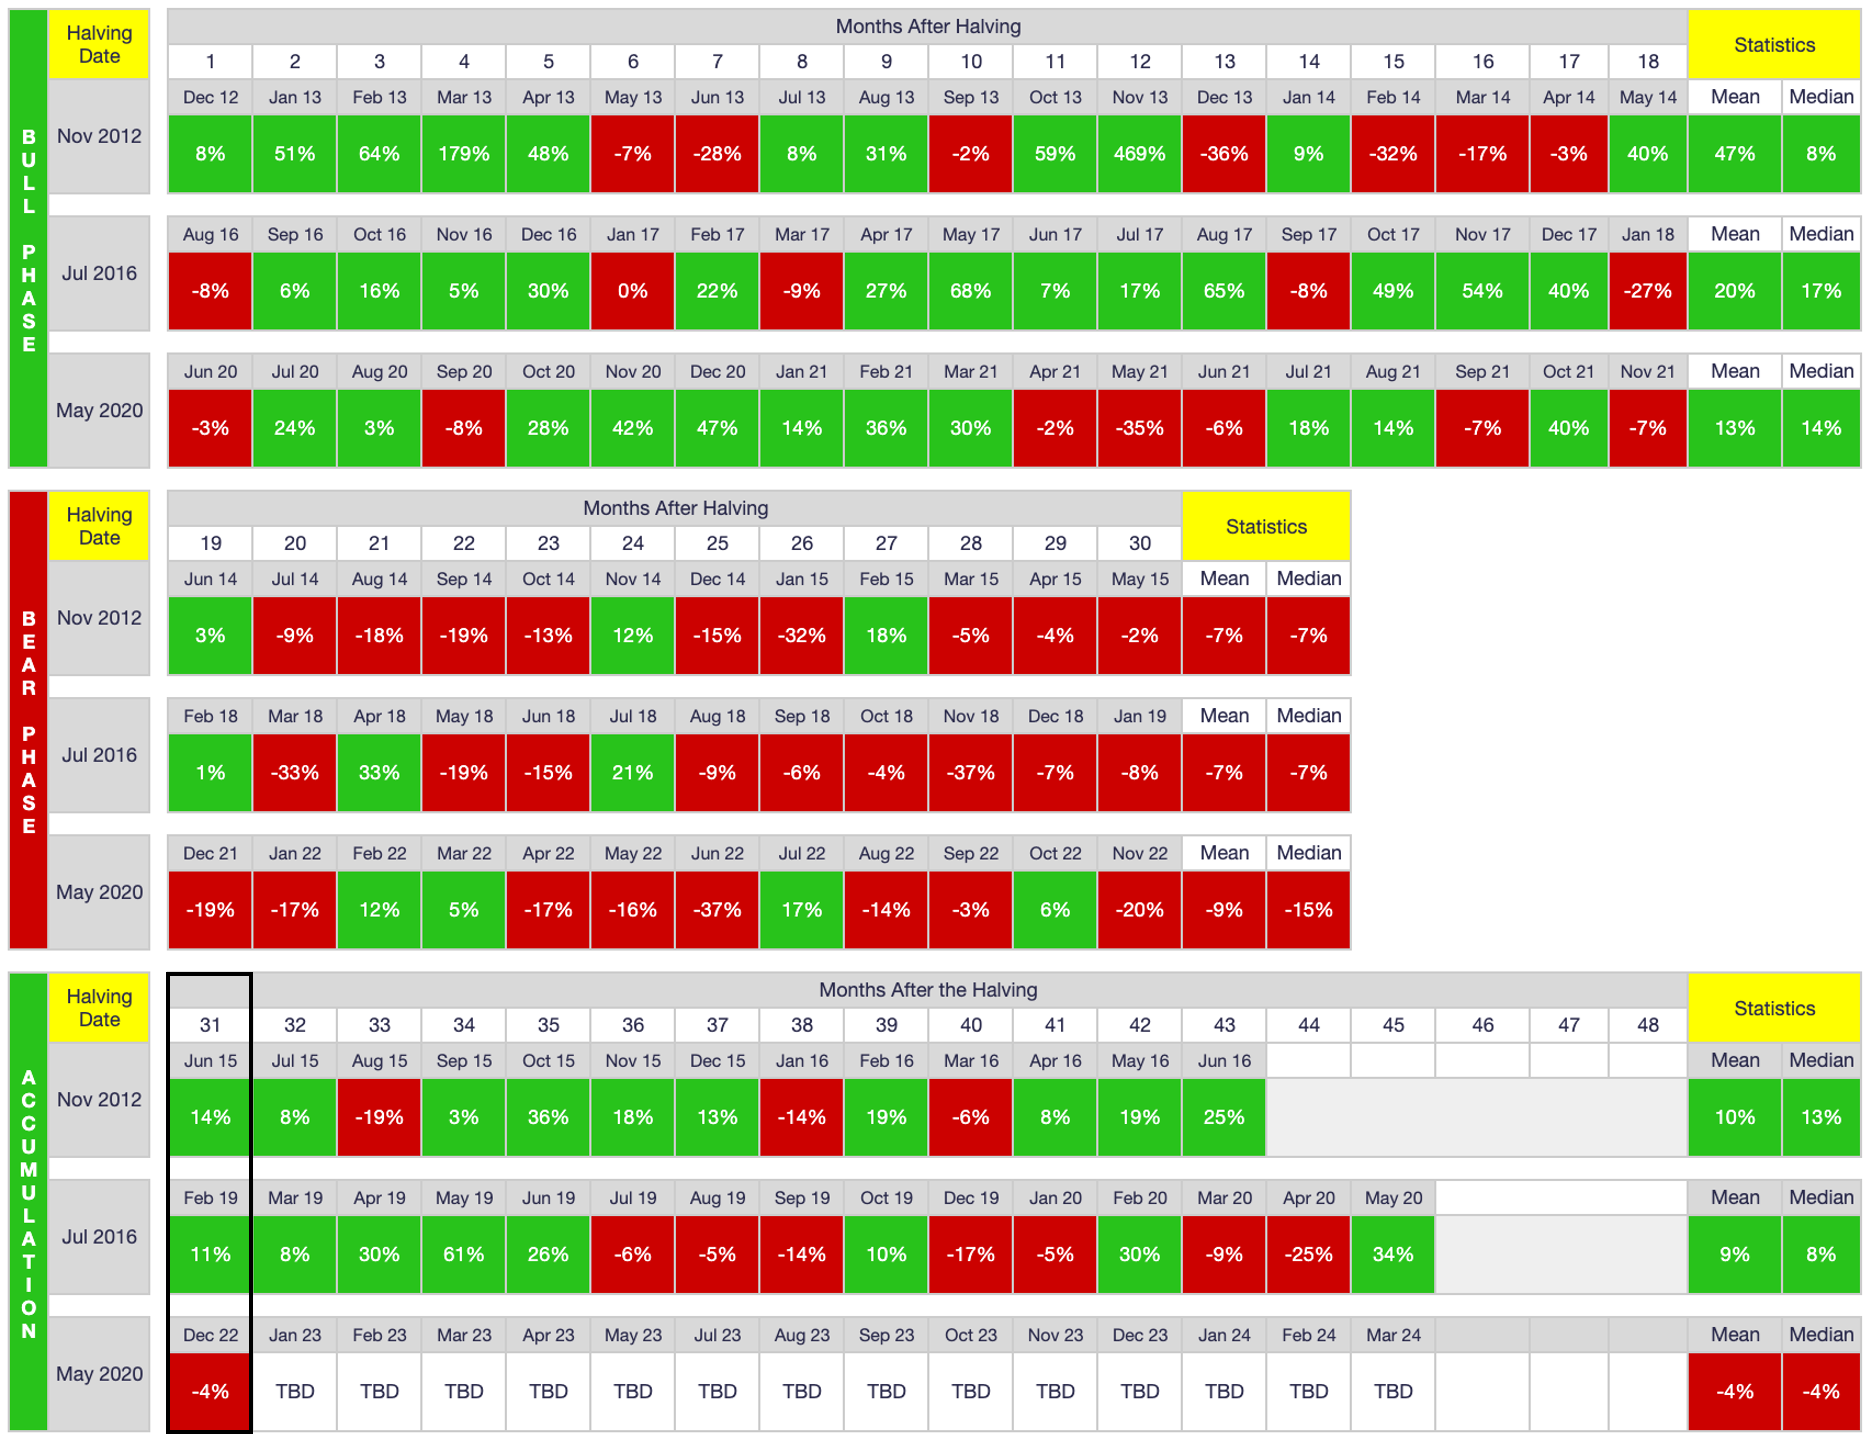
As shown above, BTC should be exiting the bear phase of its halving cycle, but the thirty-first month post-halving closed lower for the first time. While a one-month break in a multiyear trend should not engender too much concern, if January 2023 also closes lower, then it will be very hard for people to claim that the rhythm of the halving cycle still exerts any influence over PA. In fact, most of the first half of 2023 should paint green if in fact past PA is still any indication of future PA. If not, then the belief that there is a particular rhythm to each halving cycle will be all but dead.
One other trend to note with respect to monthly PA is how closely the monthly performances of 2021 and 2022 tracked each other:
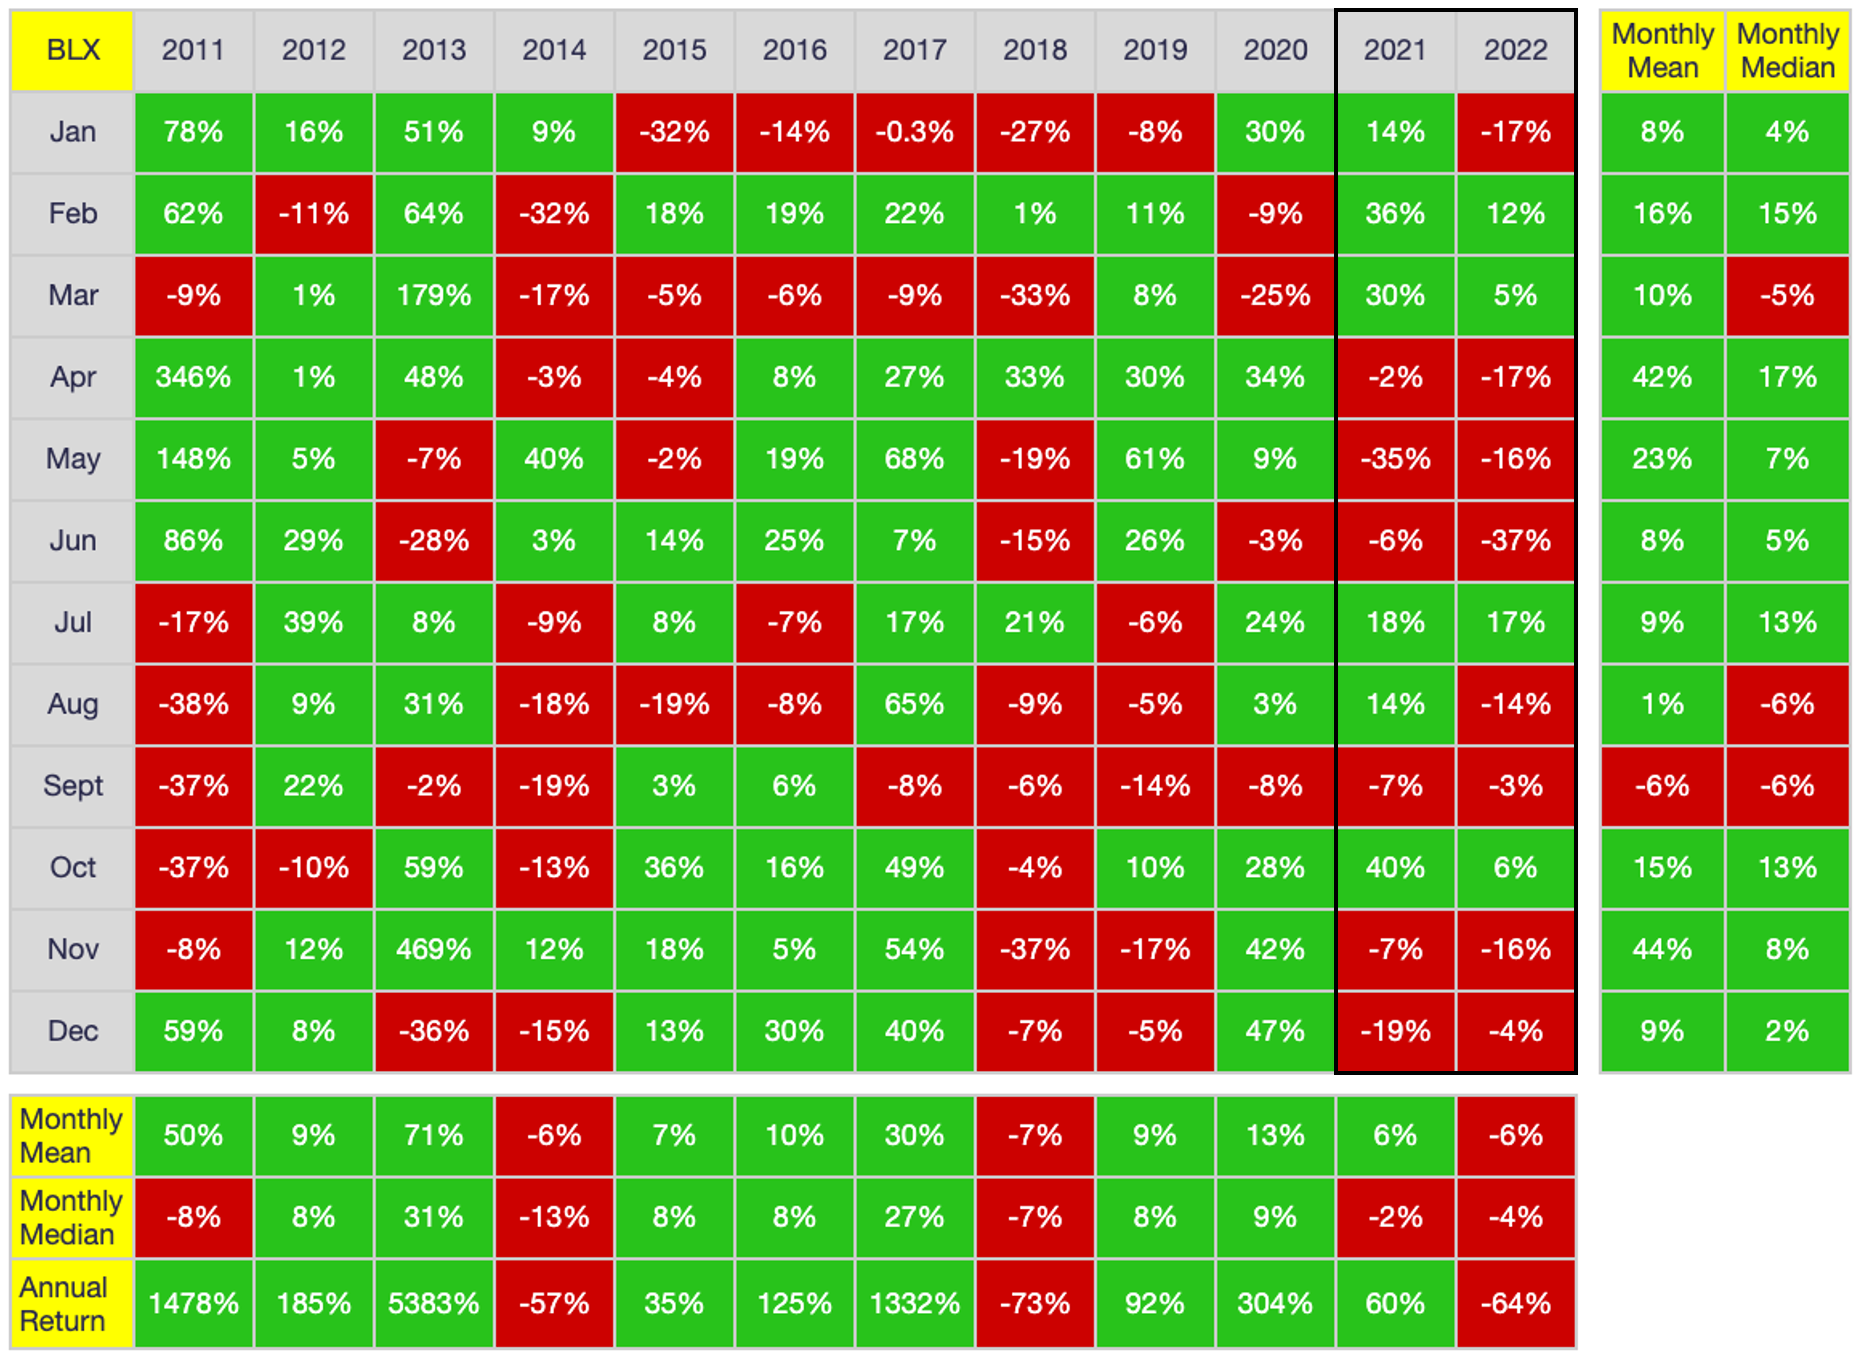
As shown above, 2021 and 2022 painted the same color in all but two months (January and August). Admittedly, the magnitude of each monthly performance differed so much that price closed 60% higher in 2021 but 64% lower in 2022. Nevertheless, it will be interesting to see whether a more seasonal PA trend is developing, where calendar-month performance begins yielding more predictive validity than halving-cycle performance. If so, it would refute my earlier claim that halving-cycle PA is more predictive than calendar-based PA.
On-Chain Data
Following are the address counts for the past 12 months.
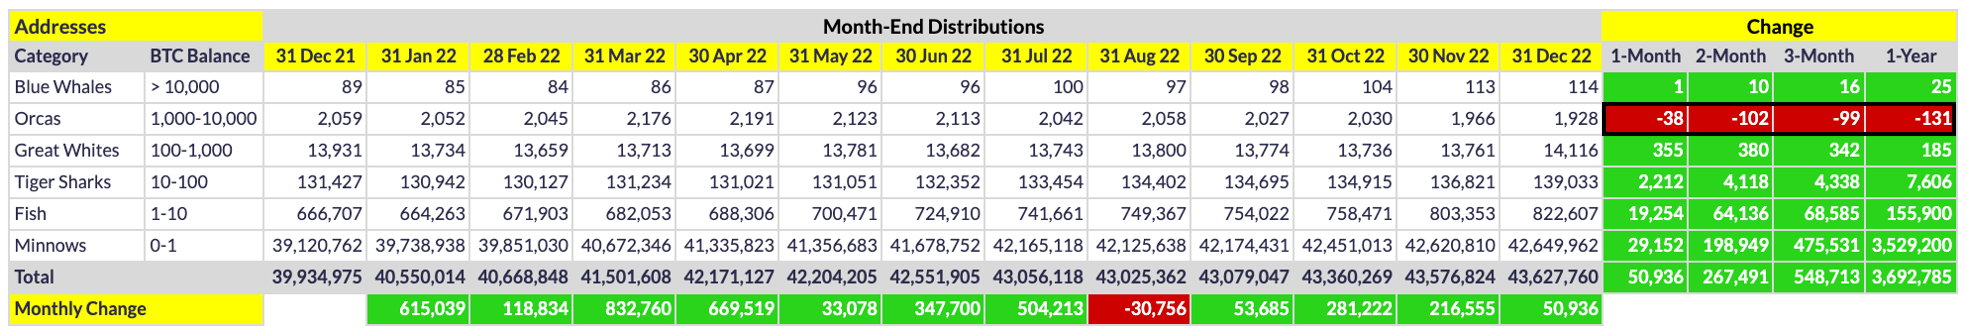
As shown above, network adoption is screaming higher overall, with a staggering 3.7M new wallets being established in 2022 and with wallet increases in all months except August. Given how abysmal PA was during 2022, the fact that 3.7M new wallets were created is all the more impressive. That said, as I have argued for well over a year now, it is the Orcas that determine PA and the above data provide the most convincing evidence yet of my claim. Yet another 38 Orcas devolved in December, culminating in a devolution of 131 Orcas year-over-year. Even when offsetting these Orca losses with the net gain of 25 Blue Whales in 2022, there were still over 100 Orcas that downsized their positions or exited the market altogether in 2022.
As many others have speculated, it is likely a fair number of these devolved Orcas are miners who were forced to sell due to declining revenues and increasing operating expenses. Still, the majority of Orcas that devolved during 2022 are the same institutional investors that FOMOed into the market in late 2020/early 2021, and that is a concern, at least with respect to price. i.e., For better or worse, price will not go substantially or sustainably higher until Orcas return in significant numbers for the reasons I explain here and here. Just look at the graph of Orca count changes vs. PA below for visual evidence of my claim:
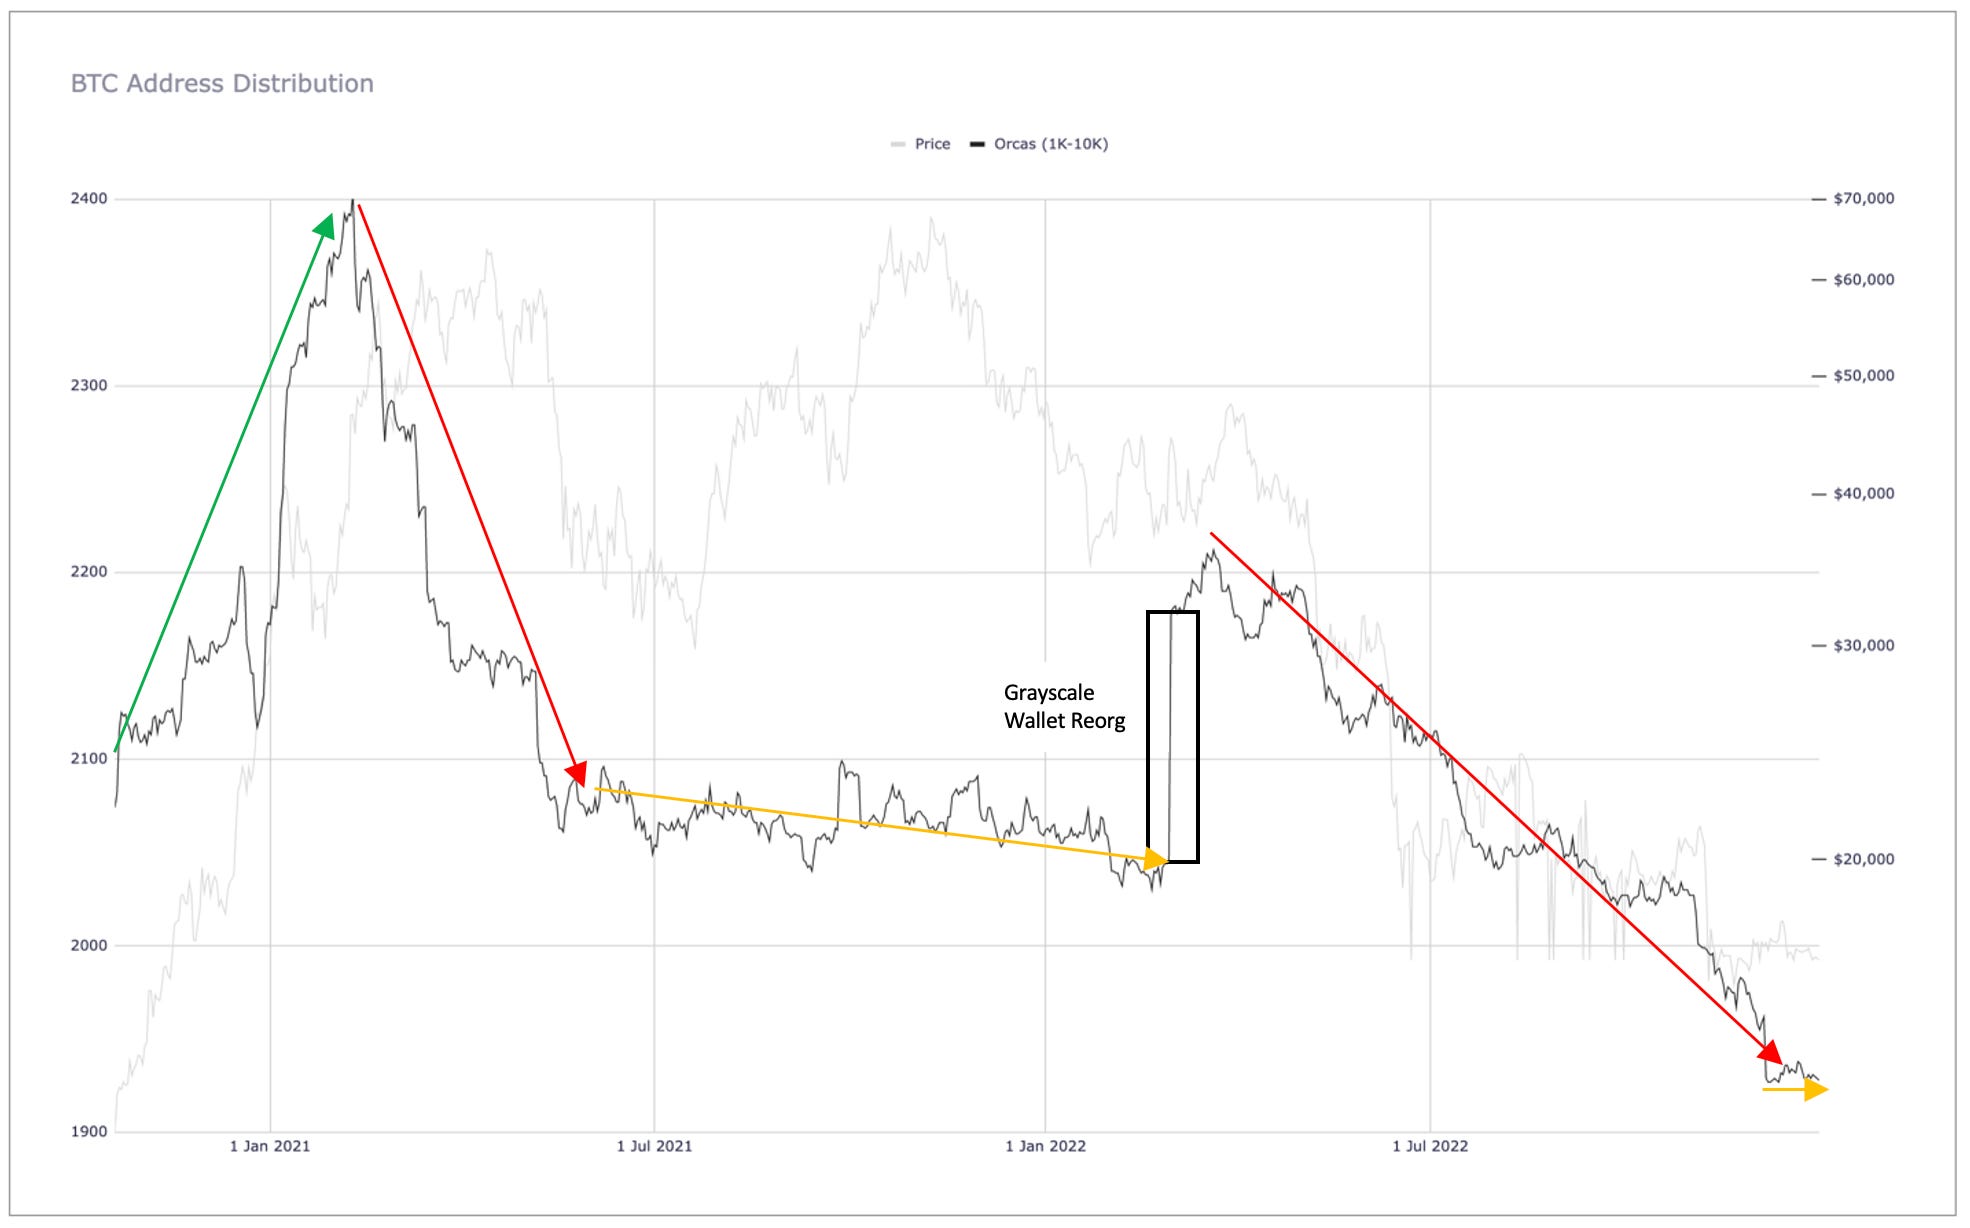
As shown above, Orca numbers skyrocketed in late 2020 and early 2021, peaking at 2,403 on February 9, 2021 (coinciding with Tesla’s purchase announcement, for what it’s worth), but they have been in a steep downtrend since (excluding the zero-sum bump due to Grayscale’s wallet reorganization on March 1, 2022). Put another way, at a current count of 1,924, Orcas are now at their lowest level since mid-2020. The one potential silver lining is that Orca counts have stabilized recently (within the past two weeks), but until their numbers start climbing again, price will be mired in a slump. But honestly, after such a rough 2022, I personally will be grateful if they simply stop contracting at this point. Anything but further contraction. Please.
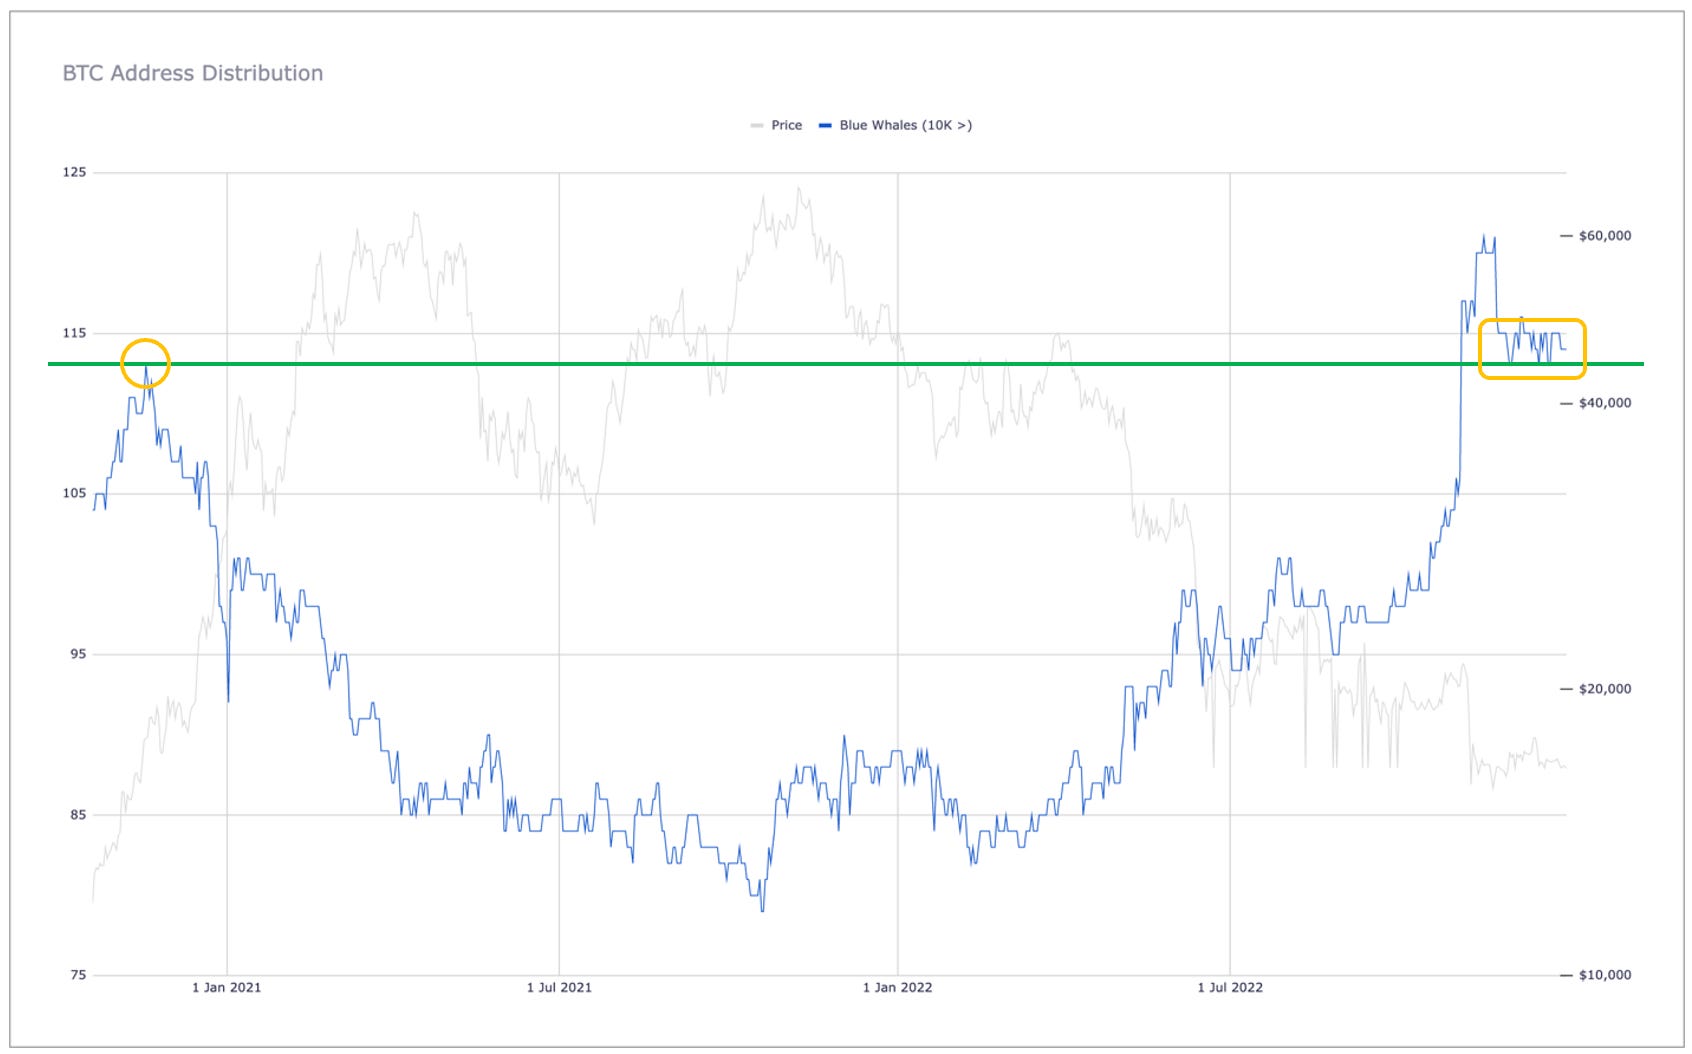
On a more positive note, Blue Whales (BWs) have been climbing steadily throughout 2022 despite (or perhaps because of) the near-constant falling price. In fact, as shown below, the BW peak of 113 (on November 8, 2020) now appears to be the new floor for the number of BWs, which if true, is very encouraging. Admittedly, a handful of new BWs are exchange wallets (e.g., Binance recently created what is now the third largest wallet), but most new BWs appear to be non-exchange wallets, indicating that at least some institutional investors have been “orange-pilled,” adding to their stockpiles throughout the downturn of 2022.
As shown below, this increase in BW numbers is reflected in their cumulative coin count, with the tier gaining 237.6K coins over the past 12 months vs. the staggering 601.9K coins that Orcas vomited over the same time period. Note also that the recent shedding of coins by BWs (83.2K in December) is due mostly to exchange outflows catalyzed by the FTX debacle rather than non-exchange BWs deleveraging. Evidence of this fact can be seen in the exchange inventory data below, where 52.8K coins flowed out of exchanges in December, which in turn is only a small part of the 290.4K coins that flowed out of exchanges over the past three months combined.
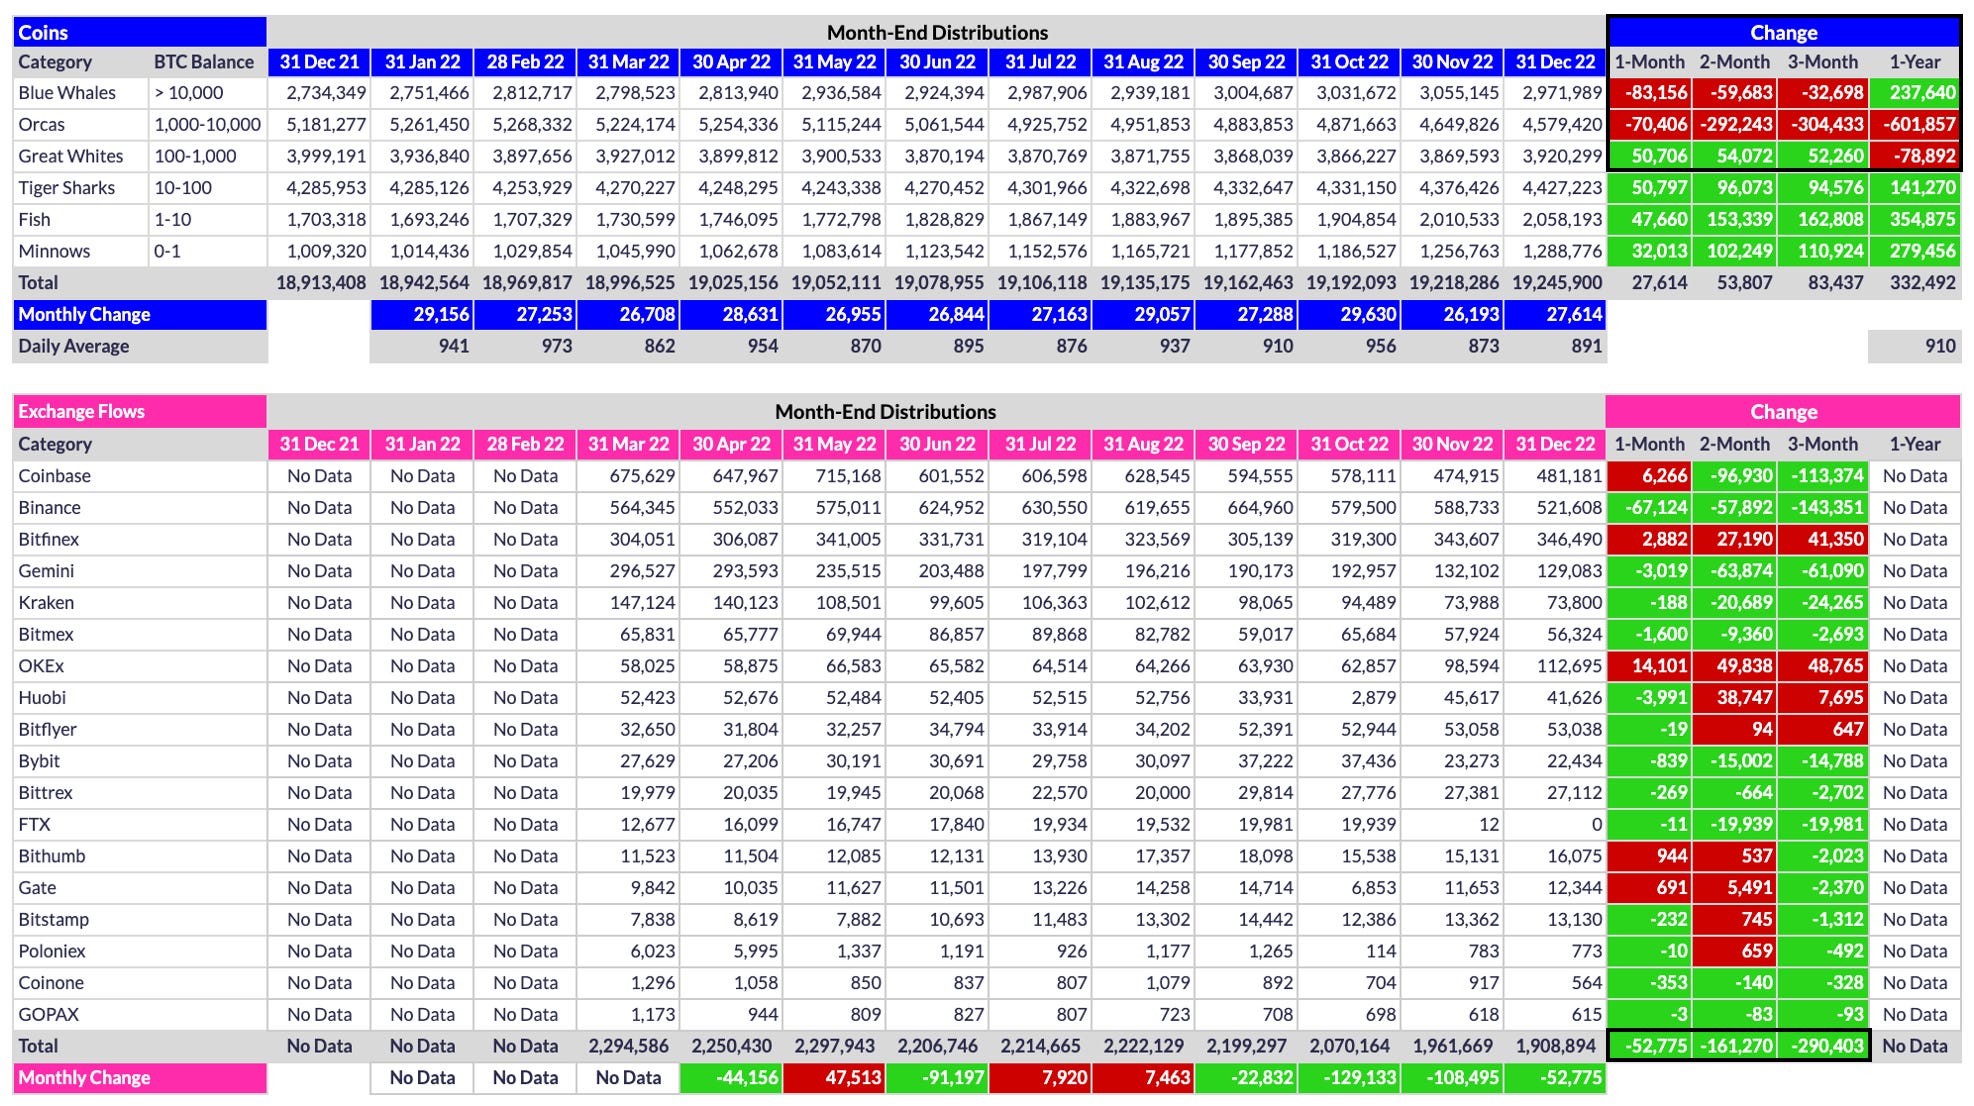
Given all of the centralized exchange (CEX) FUD caused by FTX et al., it is no surprise investors are pulling more and more coins off exchanges and putting them into cold storage. However, as shown by the remaining 1.9M+ coins still sitting on exchanges at the end of December, the much-anticipated supply squeeze that will eventually occur is still likely a long way off.
Conclusion
I will conclude this month’s analysis by highlighting one other on-chain data point that sometimes gets lost in the fray but to me may be the single most noteworthy data point of all: the number of coins mined each day.

As shown above, an average of 910 coins were mined each and every day of 2022. No matter how hot inflation ran, no matter what countries were at war, no matter what new strain of COVID appeared, no matter what crypto-specific collapse occurred, BTC’s protocol ensured that +/- 900 coins were mined each and every day. In short, nothing other than a complete collapse of the Internet can stop Bitcoin’s protocol from doing its thing and that is the reason I am a permabull. i.e., Given BTC’s finite supply and immutable decentralized protocol, I know that price will take care of itself over time. I only need to exercise some patience.
Happy new year to one and all. Here’s hoping 2023 yields more reasons for optimism than did 2022. Either way, good luck with your investing and of course…
Go #BTC.