
Month-End Analysis

Disclaimer
The data I use (BitInfoCharts, Coinglass, CoinMarketCap) to compile the tables and graphs contained in the on-chain section of this analysis do not always align with data found via others sources like Glassnode and CryptoQuant. I cannot explain the reason for the differences nor can I confirm which sources are most accurate. For this and other reasons, I have come to trust only the on-chain data I collect when trying to explain and/or predict Bitcoin’s (BTC) future price action (PA). Whether you too find my on-chain analysis useful is for you to decide, but I can assure you that some of my observations and/or predictions will differ, often markedly, from other observations and/or predictions you will see on Crypto Twitter (CT) and elsewhere.
Price Action
December 2023 was yet another green month for the corn, the fourth green month in a row. Opening at $37,718 (on Coinbase), price raced to a peak of exactly $45,000 five days later before spending the rest of the month chopping slightly lower. When all was said and done, price closed the month at $42,285, up an impressive 12.1% overall.

As shown above, 2023 was a stellar year across the board, with only three down months the entire year, the worst being a mere 11% lower. In this respect, 2023 falls short of only 2012 and 2017 in terms of month-to-month performance.
Overall, price rose a whopping 156% in 2023, the sixth largest annual return in BTC’s 13-year history and a spectacular rebound from the 64% swoon of 2022. In fact, 2023 yielded the highest return of any year following a cyclical down year (2014, 2018, 2022), substantially outperforming the rebound returns of 2015 (35%) and 2019 (92%). In short, BTC PA was nothing short of spectacular throughout 2023.
From a quarterly respective, three of the four quarters in 2023 closed higher, with Q4 up an impressive 57%, no doubt due to anticipation of one or more US spot-BTC Exchange Traded Fund (ETF) applications being approved.

Equally importantly, and to reinforce just how bullish BTC PA was in 2023, the lowest quarterly return was only -12%, putting 2023’s performance on par with 2020 in terms of quarterly PA (i.e., even without the bullishness of a halving, which greatly benefitted PA in 2020). This of course should bode well for 2024, with the next halving set to occur in late April.
Speaking of halvings, below is a table of calendar months reorganized by the three phases of each halving cycle that I have identified. As shown, we are currently in what I call the accumulation phase of each cycle, and it continues unfolding as expected:

As shown above, December 2023 is the 43rd month of this halving cycle (which began in May 2020), with four months remaining before the next halving. As shown, each accumulation phase has now had a four-month win streak at some point during the phase. Whether the current win streak continues in January 2024 of course depends on whether one or more US spot-BTC ETFs is/are approved as well as how the market reacts to such approval(s). Sentiment on CT seems evenly split at the moment, with some predicting a monumental surge in price while others view it as a sell-the-news event. As I explained last month, there is no way approval of a US spot-BTC ETF will be a sell-the-news event like it was, e.g., for the Coinbase initial public offering or BITO launch. While I acknowledge that a pullback is possible either following approval or launch, any such pullback will likely be modest and temporary. i.e., Even if price does retrace upon approval or launch, that does NOT mean an approved spot-BTC ETF will lead to a significant price collapse. Instead, I would view any such pullback as a buy-the-dip gift, with price likely recovering sooner than later, particularly with the next halving also on the horizon (NB: Only my opinion; not financial advice).
On-Chain Data
Below are the distribution of BTC addresses and coins for the past 12 months:
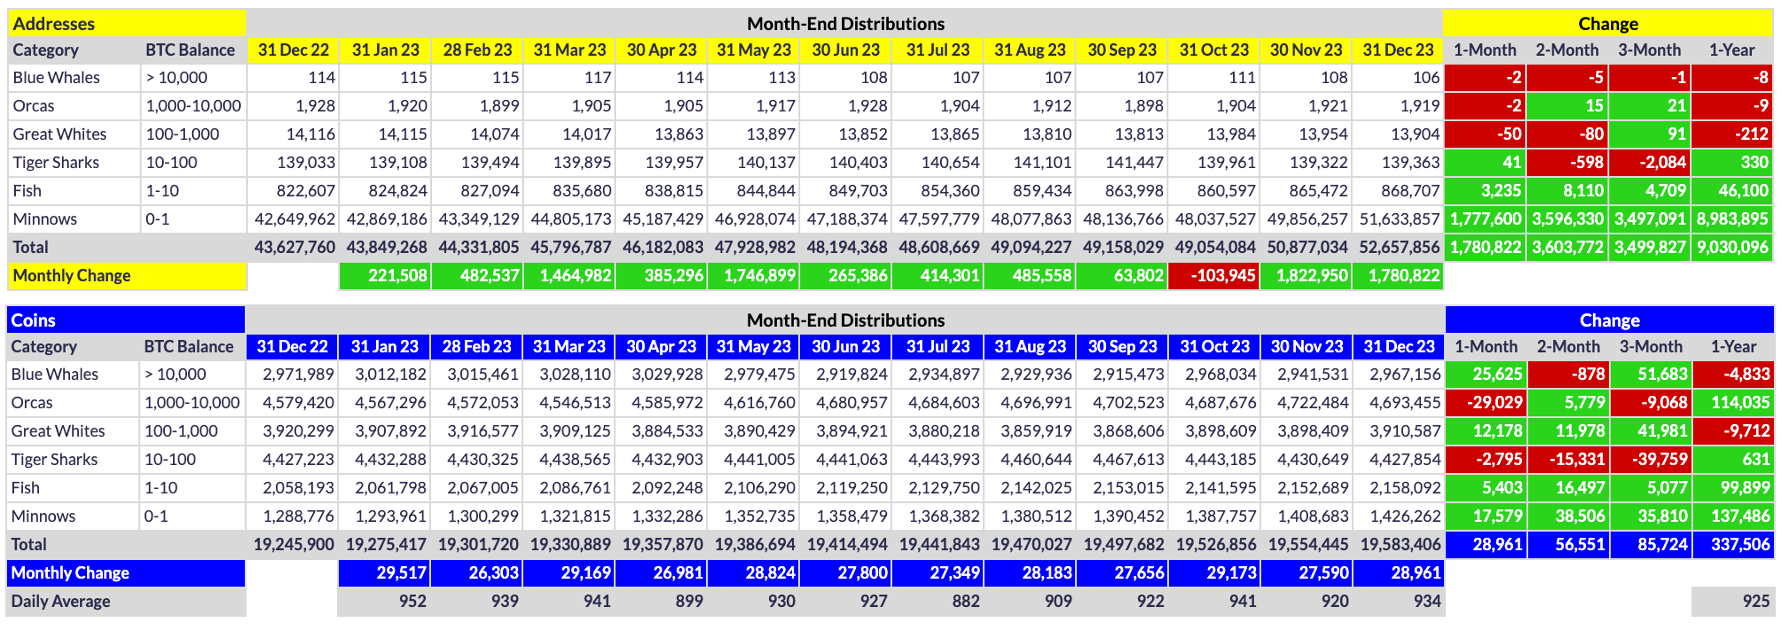
As shown, there is nothing but solid green on the lower half of each table above. For those invested in Bitcoin primarily for its ethos, the tables above should be quite the eye candy: retail adoption truly is growing exponentially, with 1.78M new retail (Fish & Minnow) addresses in December and a whopping 9.03M new retail addresses over the past year. Put another way, there has been a 20% increase in retail addresses over the past 12 months. Perhaps even more importantly, retail buyers also increased their share of BTC’s finite pie, adding a staggering 237.4K new coins to their collective stack over the past year.
Conversely, for those here primarily for NGU (number go up), the story is murkier. As I have stated for many years now (and as I explained in great detail here and here), whale growth is critical for substantial and sustainable price growth, and as the tables above illustrate, whale growth has been mixed the past 12 months. Eight Blue Whales (BWs) devolved over the past year, although (thankfully) they shed only 4.8K coins as a tier over the same period. I interpret these data to mean that some relatively new BWs sold all or parts of their stacks in 2023, cashing out sizable profits after buying in during 2022, while other diamond-fisted BWs happily devoured many of the coins vomited by those exiting the pod.
The same can be said for the Orcas, although the disparity is far greater: a net nine Orcas devolved over the past year, but the tier as a whole added a whopping 114K coins to their collective stack, second only to the Minnows in terms of net coin accumulation in 2023. In this respect, when looking only at coin accumulation, the only sellers were the Great Whites (GWs), which in some respects is to be expected, as many GWs seem to be large traders. i.e., I suspect many of the net 212 GWs that devolved in 2023 entered the market in late 2022 and took profits all throughout 2023, leaving the tier with 9.7K fewer coins by year end.
In sum, while top-tier on-chain data were mixed in 2023, the huge coin accumulation among Orcas is likely the primary catalyst that propelled price 156% higher in 2023. Still, whale counts per se matter for price appreciation over the long term, so if 2024 is to be yet another bullish year, whale counts must substantially increase in 2024, whether that be via individual purchases or US spot-BTC ETFs. Otherwise, 2024 PA may fall short of current expectation.
The two graphs below illustrate both my concern and my optimism going into 2024:
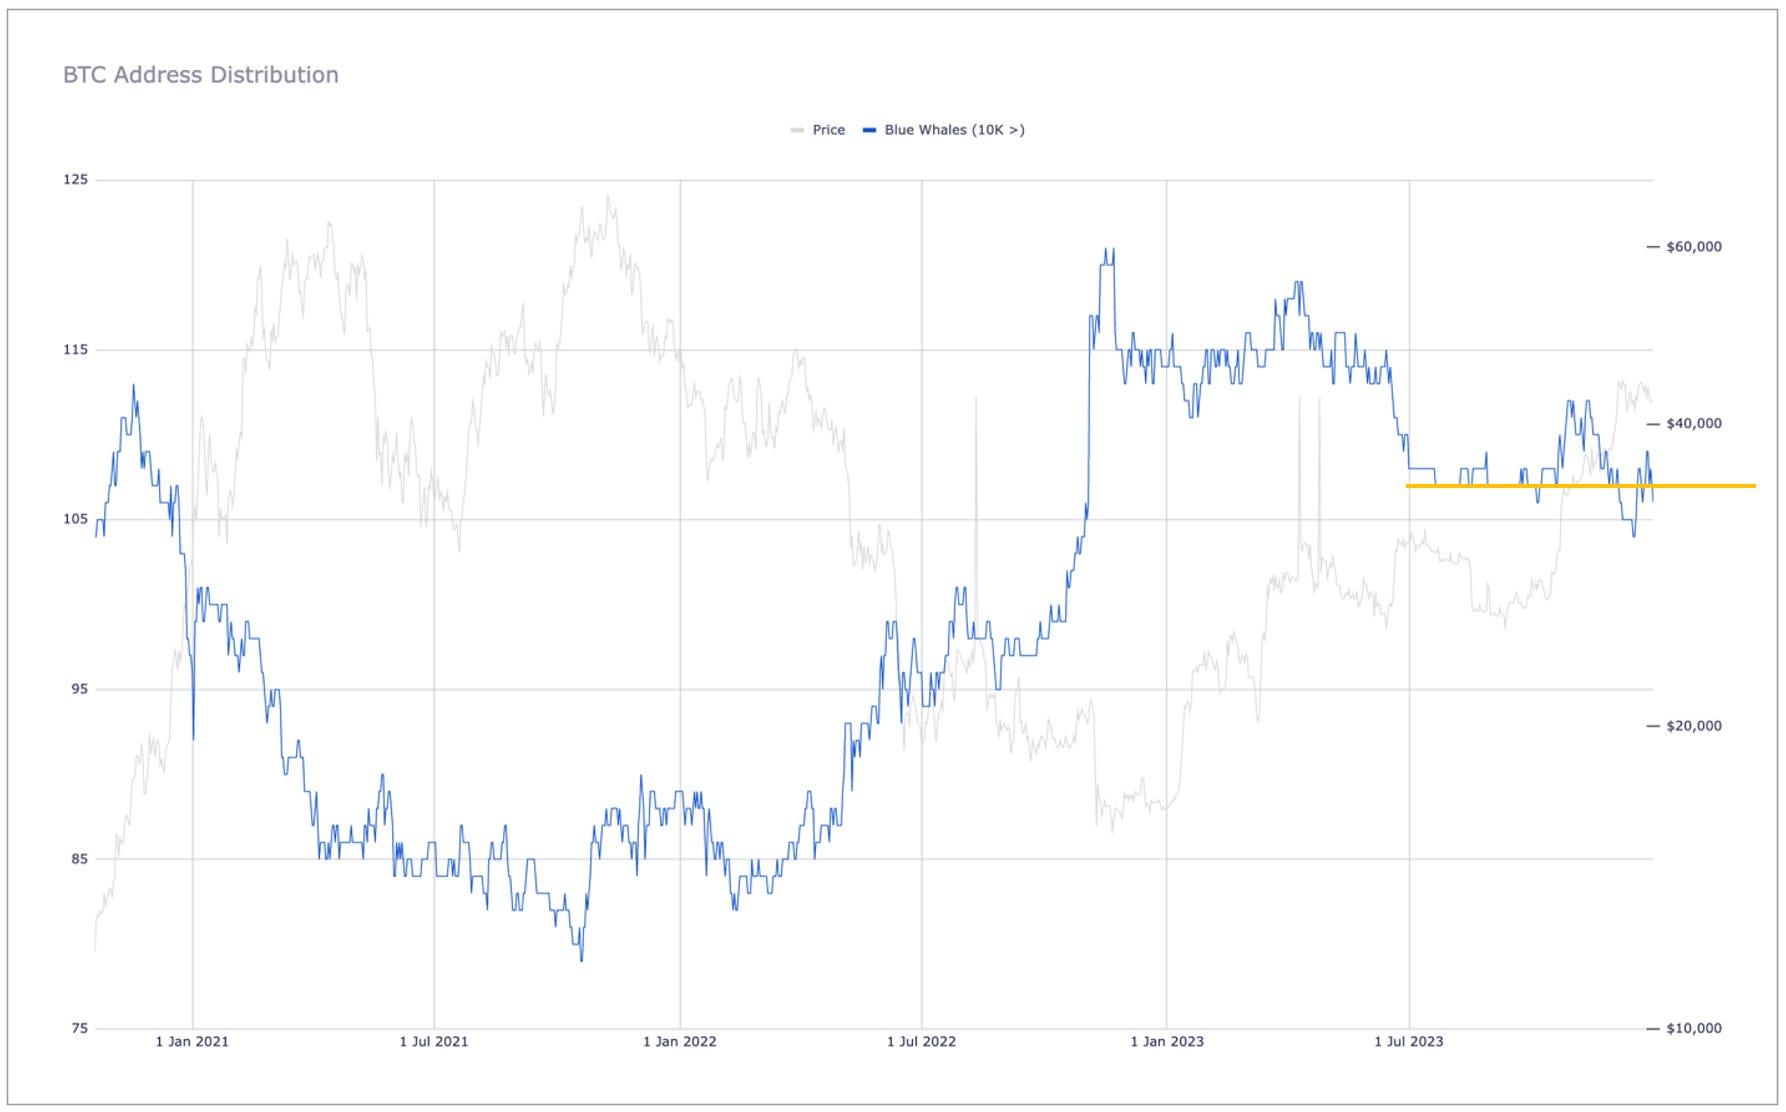
As shown above, BW counts have been fairly stable since July (hovering around 108) following a sizable contraction between March and June (from 117 to 108). Perhaps unsurprisingly, the cycle peak for BWs (121) occurred on November 22, 2022, which is literally the day following the absolute nadir of the bear market in terms of price (November 21, 2022 closed at $15,760). In short, the massive address gain in new BWs in 2022 has largely retraced, but the stasis that has since been achieved is still higher than at any other point this cycle, including the mania phase of late 2020/early 2021. i.e., Even though many new BWs cashed out in 2023, several others became diamond-fisted hodlers along the way, which is great.
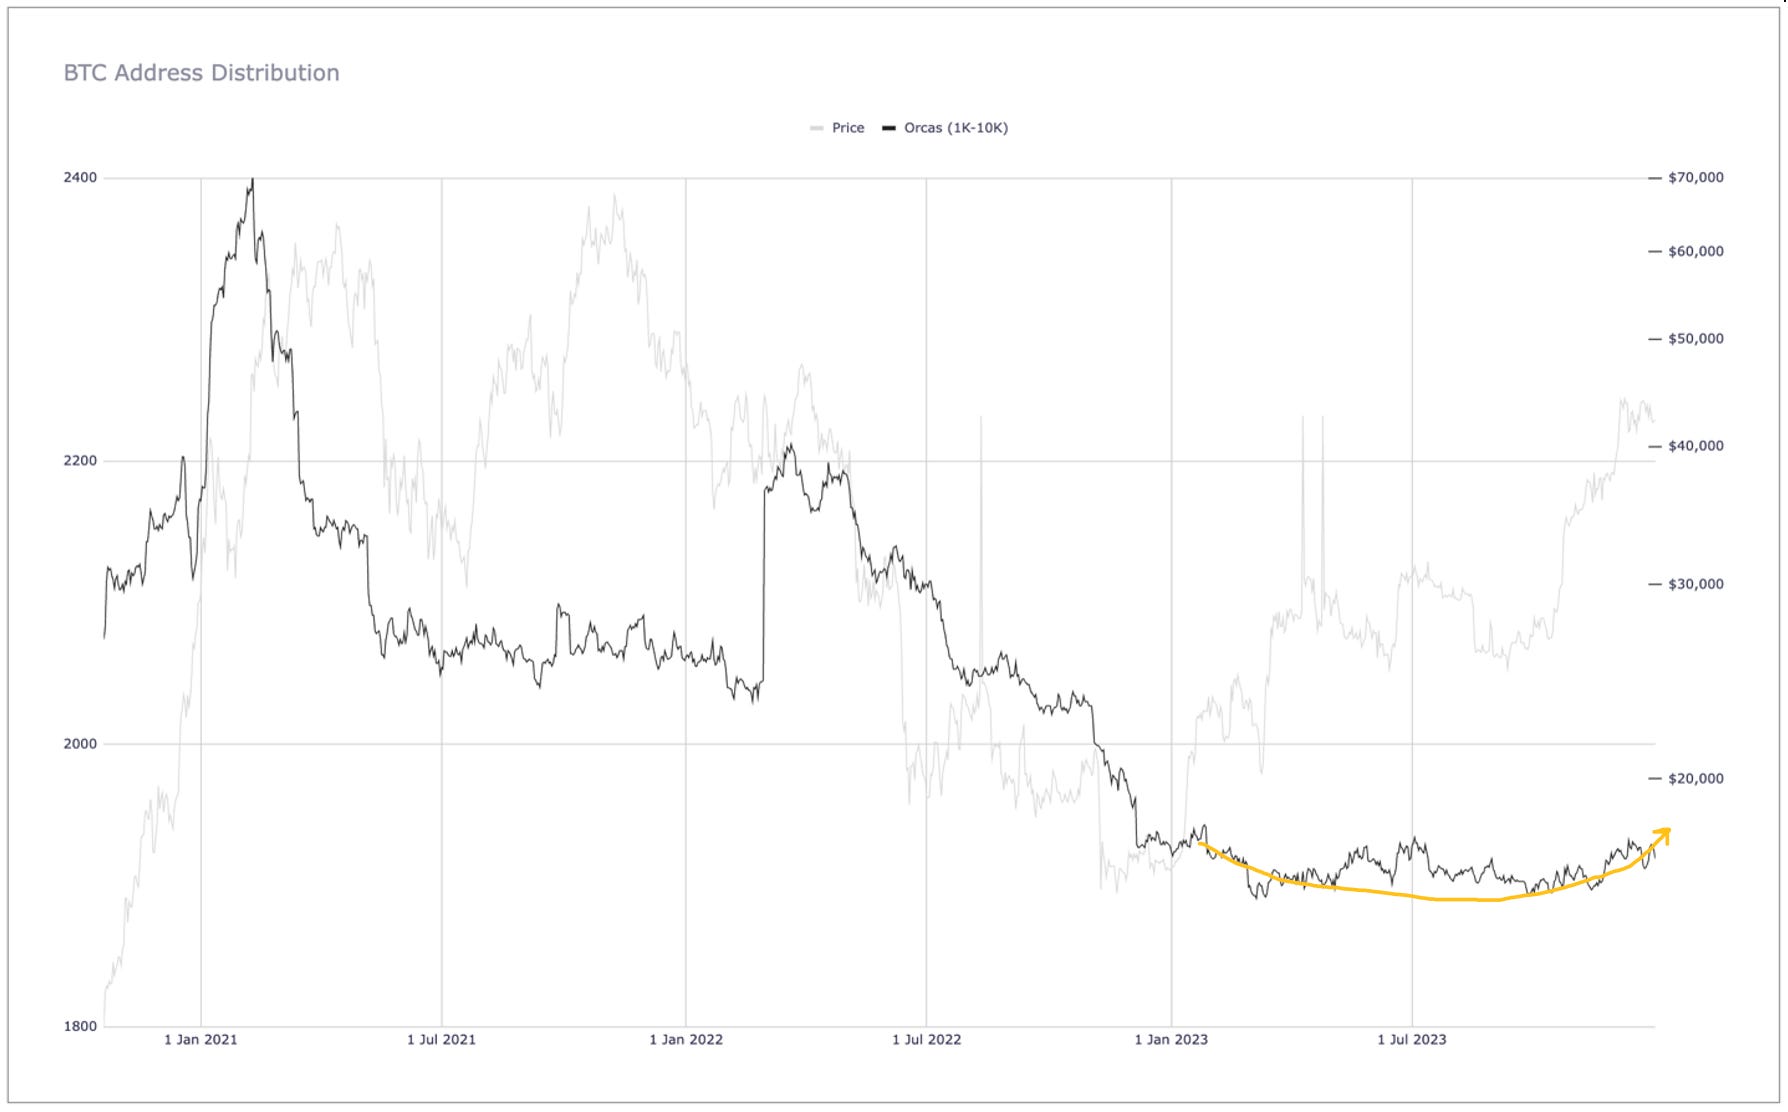
The Orca-count data are equally promising. As shown below, Orca counts were relatively stable throughout 2023 but with the trend generally higher of late. As shown in the address table above, there has been a net increase of 21 Orcas since the end of September (from 1898 to 1919), with a local high of 1921 being reached in November. Again, Orca increases are vital to both substantial and sustainable price increases, so this general upward trend is encouraging. That said, when looking across the entire cycle, Orca counts are at a cycle low overall, with nearly 500 fewer Orcas now than at the cycle peak of 2403 on February 9, 2021. As such, we really need the current upswing in Orca count to not only continue but actually pick up steam in 2024 if we expect more eye-popping price growth going forward.
That said, as I alluded to earlier and explained in great detail last month, US spot-BTC ETFs will become a very attractive vehicle for many would-be whales, so it will be interesting to see how easily we will be to track new institutional buying via ETFs. In theory, dozens if not hundreds of new whale wallets will be created along the way, so we should see the gross numbers of each whale tier accelerate quite rapidly in the months ahead, at least if ETFs induce the inflows so many seem to be anticipating.
Finally, below are the exchange inventory data for the past 12 months:
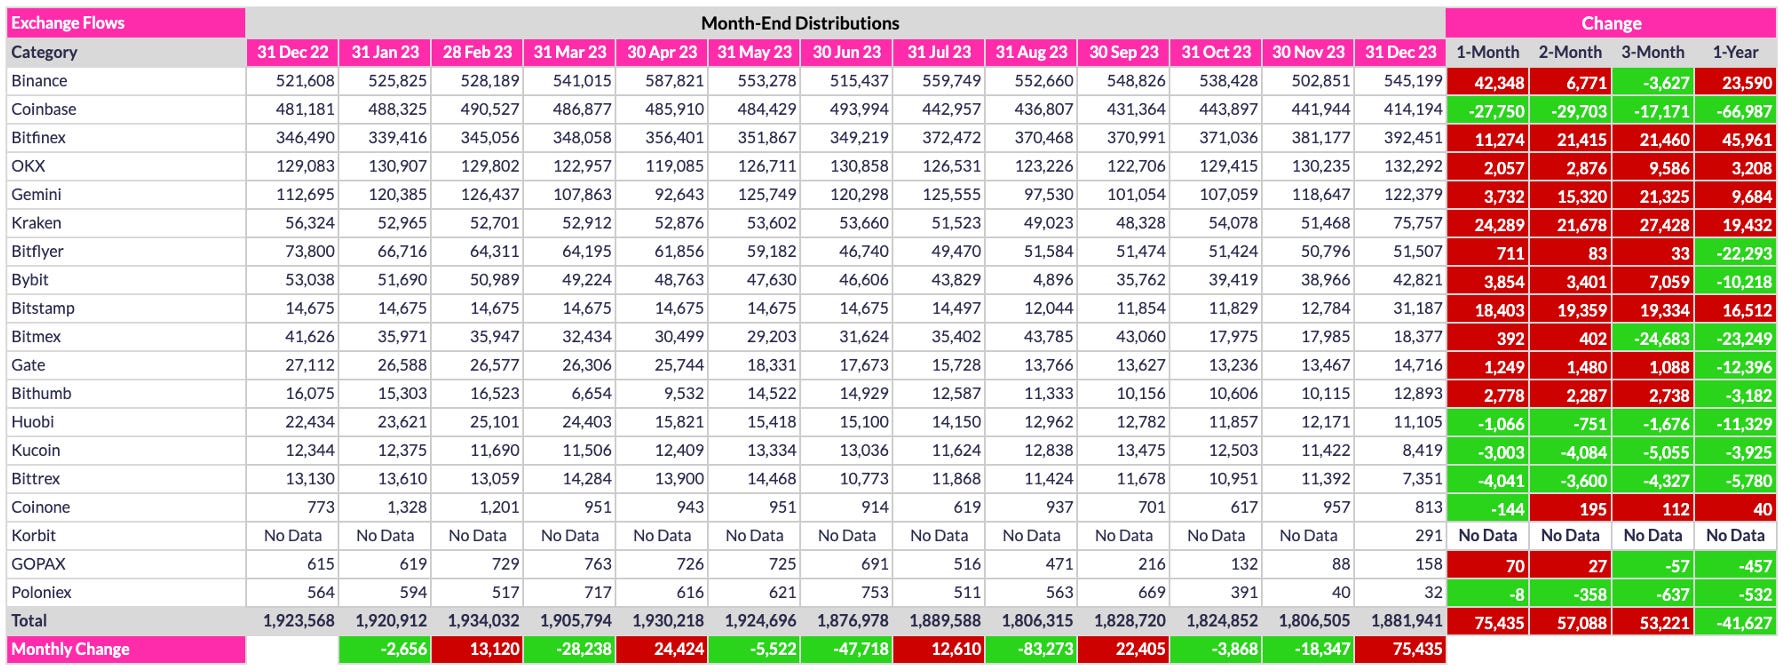
As shown, most of the major exchanges (sans Coinbase) had sizable inflows in December, leading to a total overall exchange inflow of 75.4K coins. Normally this would be a red flag, as inflows are interpreted to mean a precursor to selling, and this could indeed be the case. i.e., If a large number of whales are preparing to sell into what will undoubtedly be a spike in buying pressure the moment US spot-BTC ETFs are approved, then yes, the spike could not only be stunted but also eventually lead to a sizable selloff. While I acknowledge this is indeed a possibility, as I explained above, this is not my so-called base case. Equally importantly is the fact that my data source often exhibits anomalies. For example, the data occasionally fail to refresh for several days at a time; in other instances, individual exchange balances have exhibited extraordinary swings that self-corrected several days later. Finally, in some cases, @Coinglass_com seem to scrub their data, with updates to the wallets they identify as exchange wallets. It is this latter scenario that I think applies to the recent exchange inflow. I believe this for two reasons: 1) there has been no selloff since the inflow; quite the opposite, in fact; and 2) the increases occurred across most of the listed exchanges. i.e., I think Coinglass recently reviewed all on-chain data and identified several new wallets as exchange wallets, thereby increasing the number of coins in their exchange inventories even though no (or little) actual increase occurred.
I have reached out to Coinglass for confirmation of my interpretation, but I have not yet heard back. I will certainly share anything I learn via my daily distro updates on Twitter. In the meantime, we should all watch subsequent exchange-balance updates to see whether there is any reason to fear what could potentially be an avalanche of selling post-ETF decision announcement. But again, this is not a scenario that worries me personally. I am nothing but bullish on PA for 2024, even if price retraces a bit following ETF application decisions.
Conclusion
Although some may have experienced a bit of a letdown in December, especially after price screamed higher the first five days of the month, it is hard not to be pleased with a 12% gain overall, especially considering that December 2023 marks the fourth monthly gain in a row. All told, 2023 was a spectacular year for Bitcoin, both in terms of price growth (156%) and, perhaps even more importantly, network growth. Retail addresses increased by 9 million in 2023, representing a 20% increase since 2022, the largest single-year increase in Bitcoin history. In short, Bitcoin the network has never been healthier than it is right now, both in terms of network adoption and hash rate, which reached a new all-time high just a week ago (on December 24). With the next halving only four months away and US spot-BTC ETF approval only days away, there is every reason to be optimistic both in terms of price and network growth as we head into 2024. Of course, I have also learned over the past four years that anything is possible in Bitcoinistan, so I for one will not count my chickens before they hatch.
Go #BTC.